Labour Force Survey Annual Highlights (2020)
COVID-19 has had a massive negative impact on Canadian employment. At its peak, Statistics Canada estimated that over 5 million Canadians had either lost their job or had their working hours reduced by more than 50% due to the pandemic.
COVID-19 hit the tourism sector particularly hard. Before the pandemic, over 2 million Canadians worked in the tourism sector, of whom 880,000 had lost employment by April. And unlike other sectors of the economy, tourism has faced ongoing challenges getting people back to work.
Because tourism has significant seasonal peaks, it can be difficult to tell from monthly data whether the COVID-19 pandemic or seasonal demand is driving employment trends. For example, over the summer months, the travel services industry appeared to have suffered the worst employment losses of any tourism industry (up to 50%). But summer is a period of weak demand for the travel services sector. Conversely, it is a high point for the accommodation industry, which appeared to be doing “relatively” well in terms of employment compared to travel services. Come December, this trend had reversed, with employment in travel services having increased for three consecutive months, while the accommodation sector had suffered three consecutive months of employment decreases.
Annual Labour Force Survey data allows us to evaluate the overall impact COVID-19 had on each tourism industry group in 2020, free of any seasonal variations in the monthly data.
Annual Average Employment by Industry
By this measure, all tourism industries have seen a massive negative impact on employment. The tourism sector employed 464,000 fewer Canadians in 2020 than in 2019, an employment decrease of 22.2%. Annual employment in the tourism sector has not been this low since 2001. Comparatively, overall employment in Canada is down 5.2%.
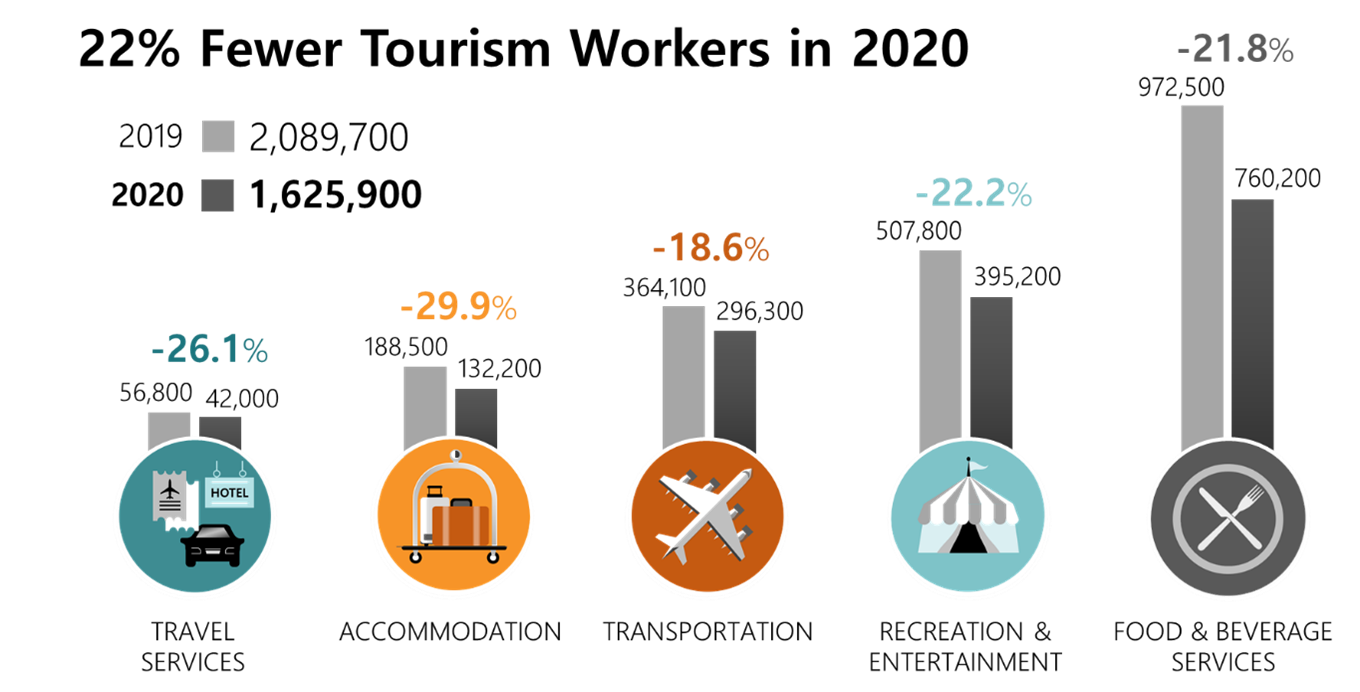
The accommodation industry was the hardest hit, with employment down 30%, a loss of 56,000 employed workers. The food and beverage services industry lost the greatest number of workers (212,000), with employment falling from 972,500 in 2019 to 760,200 in 2020, a loss of 22%.
The transportation industry group suffered the smallest loss of employment, which was still down over 18% compared to the previous year. On its own, this would be considered a massive hit to employment. Only in comparison to the other tourism industry groups can the transportation industry be described as doing “relatively” well.
It is also worth noting that both the transportation and recreation and entertainment industry groups contain several disparate industries. Within the transportation industry group, employment in rail transportation is “only” down 7.3%, whereas employment in the scheduled air transportation industry is down 34.1%.
By province, employment losses ranged from 27.3% in Saskatchewan to 13.5% in New Brunswick.
Annual Average Unemployment by Industry
Unemployment increased significantly last year. Overall, the monthly unemployment rate peaked in April, declined through the summer, and has moved neither higher nor lower since October. The tourism unemployment rate has followed a similar trend, albeit at a much higher level. The annualized data shows exactly how great the difference has been.
Unemployment levels in the overall economy were 3.8 percentage points higher in 2020 than in 2019, at 9.5%. In contrast, unemployment in the tourism sector was 11.4 percentage points higher than in 2019, at 16.5%. The accommodation industry group had the highest annualized unemployment rate at 22.4%, followed by recreation and entertainment (18.0%), travel services (17.5%), and food and beverage services (17.0%). The transportation industry group had the lowest unemployment rate at 9.7%, but this was still 7.1 percentage points higher than in 2019.
Annual Average Unemployment by Province (Tourism vs. Labour Force)
In every single province, the tourism unemployment rate was higher than the overall unemployment rate. This was a significant reversal from 2019, when tourism unemployment was lower than overall unemployment in every province except Quebec.
Table: Annual Unemployment and Tourism Unemployment Rates by Province
| Annual Unemployment Rate | Annual Tourism Unemployment Rate | |
| Canada | 9.5% | 16.5% |
| Newfoundland and Labrador | 13.7% | 15.2% |
| Prince Edward Island | 10.4% | 20.5% |
| Nova Scotia | 9.6% | 13.1% |
| New Brunswick | 9.8% | 13.0% |
| Quebec | 8.8% | 18.6% |
| Ontario | 9.6% | 16.6% |
| Manitoba | 7.9% | 13.6% |
| Saskatchewan | 8.3% | 12.9% |
| Alberta | 11.3% | 15.7% |
| British Columbia | 8.8% | 15.5% |
Prince Edward Island had the highest tourism unemployment rate, at 20.5%. Prince Edward Island was also the province with the greatest gap between the overall employment rate (10.4%) and the tourism unemployment rate (20.5%). Saskatchewan saw the lowest tourism unemployment rate, a still very high 12.9%. Despite its relatively low tourism unemployment rate, Saskatchewan suffered the greatest loss of tourism employment as a percentage of 2019 employment levels. While counterintuitive, it may be because Saskatchewan had a weaker increase in tourism employment over the summer months. This suggests a greater likelihood that Saskatchewan tourism workers who lost their jobs in March and April found work in other industries. In turn, that would have brought the monthly tourism unemployment rate down, which in turn affects the yearly average.
National Monthly Unemployment Rate (Tourism vs. Total Labour Force)
The national tourism unemployment rate started the year just 0.1 percentage point lower than the overall unemployment rate. With the pandemic’s outbreak, the tourism unemployment rate exploded, peaking at 29.7% in May. The overall unemployment rate peaked at a high (but much lower) 13.8%. Over the summer, tourism unemployment and overall unemployment dropped, particularly in September. Students exiting the labour force and no longer looking for work would have caused the September drop. Since then, the overall unemployment rate has remained relatively stable. The tourism unemployment rate has shifted up and down in response to renewed COVID-19 restrictions, which have impacted tourism employment much more than overall employment levels.
Annual Unemployment Rate (Tourism vs. Total Labour Force) 1997–2020
Between 2005 and 2008, the tourism unemployment rate closely mirrored that of the Canadian economy. But starting in 2008, those rates diverged. The financial crisis drove up the unemployment rate in all industries, but tourism was less affected than the overall economy. For a decade after the financial crisis, tourism unemployment was consistently about a percentage point lower than the overall unemployment rate. That trend came to a crashing halt last year. Overall, unemployment spiked to 9.5% (higher than at the height of the financial crisis), whereas tourism unemployment soared to 16.5%. In most provinces, the tourism unemployment figures are unprecedented.
Tourism HR Insider subscribers receive monthly estimates of employment and unemployment for each of tourism’s five industry groups and for each province. To sign up, click here.
You can also get detailed Labour Force Survey data by occupation and region through our Rapid reSearch tool, hosted on emerit.ca. Sign up for an account to gain access to the data.

This project is funded by the Government of Canada’s Sectoral Initiatives Program
The opinions and interpretations in this publication are those of the author and do not necessarily reflect those of the Government of Canada.
Source: Adapted from Statistics Canada’s Labour Force Survey. This does not constitute an endorsement by Statistics Canada of this product.