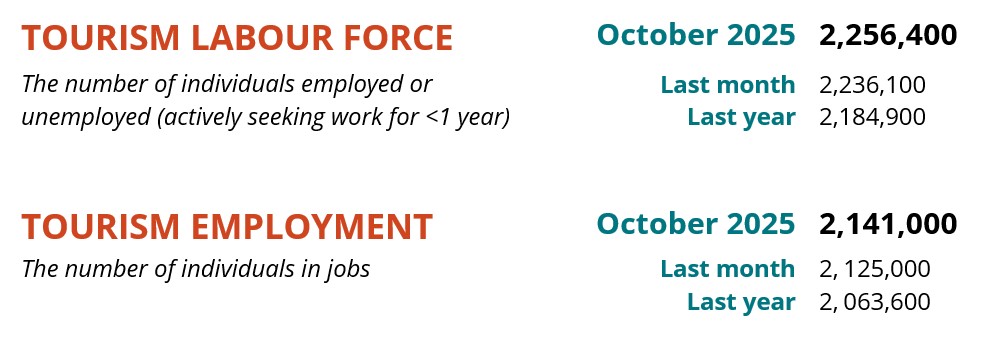
Tourism holds steady from September.
The tourism sector[1] in October 2025 saw little change over the previous month in terms of labour force or employment[2]. Both indices grew by less than one percent, on par with changes seen across the broader economy.
In spite of the strong economic headwinds caused by ongoing trade tensions with the USA, domestic interest in tourism has sustained the sector. Year-over-year workforce growth held steady at around 3%, and overall the sector was also around 3% larger than it was in 2019, although this aggregate masks variation between industry groups.
At the industry group level, accommodations and travel services lost workforce from September, while the other industries saw small to moderate gains. The picture was more consistent with respect to last year.
Table 1 provides a snapshot of each industry group’s performance across labour force, employment, and unemployment, as compared with September 2025 [MoM], October 2024 [YoY], and October 2019 as a pre-pandemic baseline. Small arrows represent changes of less than 1% (or one percentage point, in the case of unemployment).
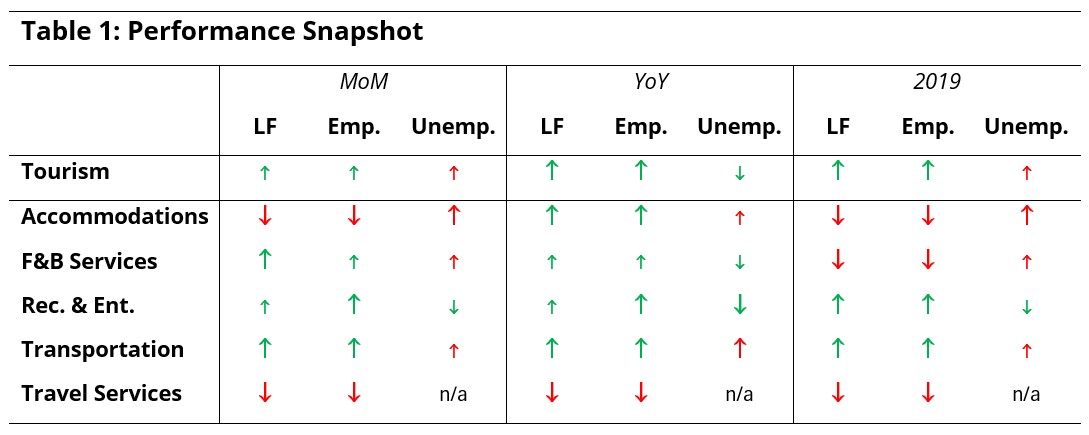
The month-over-month growth from September to October was broadly consistent with trends observed over the past few years, and may be a reflection of post-secondary students lining up part-time work as they get settled into their programs of study. Post-pandemic recovery continues to be led by recreation and entertainment and transportation, which alone were in stronger positions than they were in October 2019.
Tourism Sector
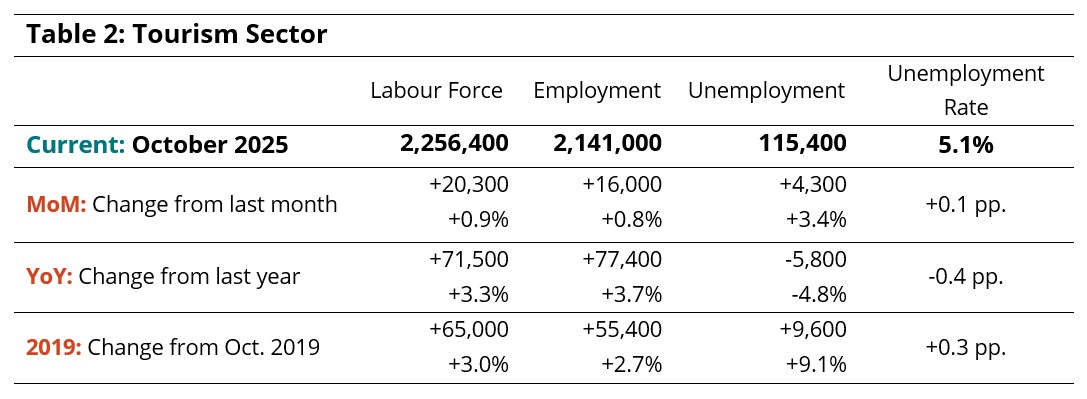
The tourism sector in October saw around 20,000 people enter the labour force, bringing the total to around 2.26 million, with around 2.14 million of those in employment (+16,000 from September) (Table 2). This mismatch pulled the unemployment rate up by one tenth of a percentage point, to 5.1%, with around 115,000 people not working but available and looking.
There were around 77,000 more people working in tourism this October than last year, and around 55,000 more relative to 2019, but this aggregate estimate masks variation at the industry level (see industry-level discussion in following sections).
Across all sectors, the unemployment rate in October was 6.3% (calculated using seasonally unadjusted data), down from 6.6% in September but still around one percentage point higher than in tourism. The broader economy saw around 86,000 people enter employment from September (Table 3), which pulled the unemployment numbers down.
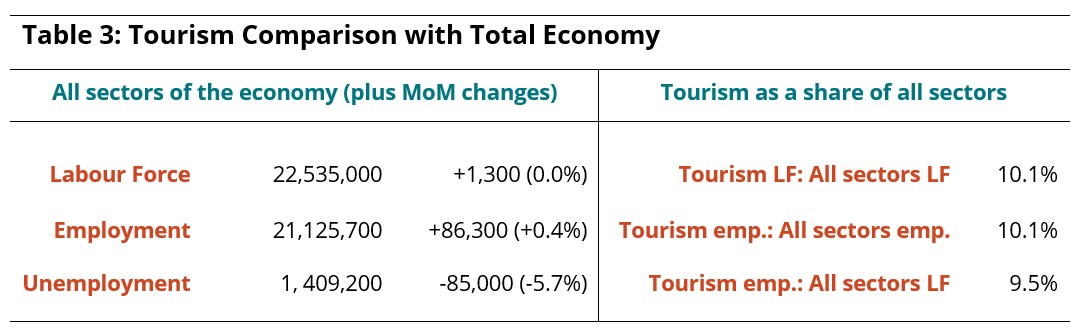
In October, tourism employment accounted for about 10% of all employment in Canada, which is little changed from last month; around 9.5% of the total Canadian labour force were working in tourism.
Part-Time and Full-Time Employment
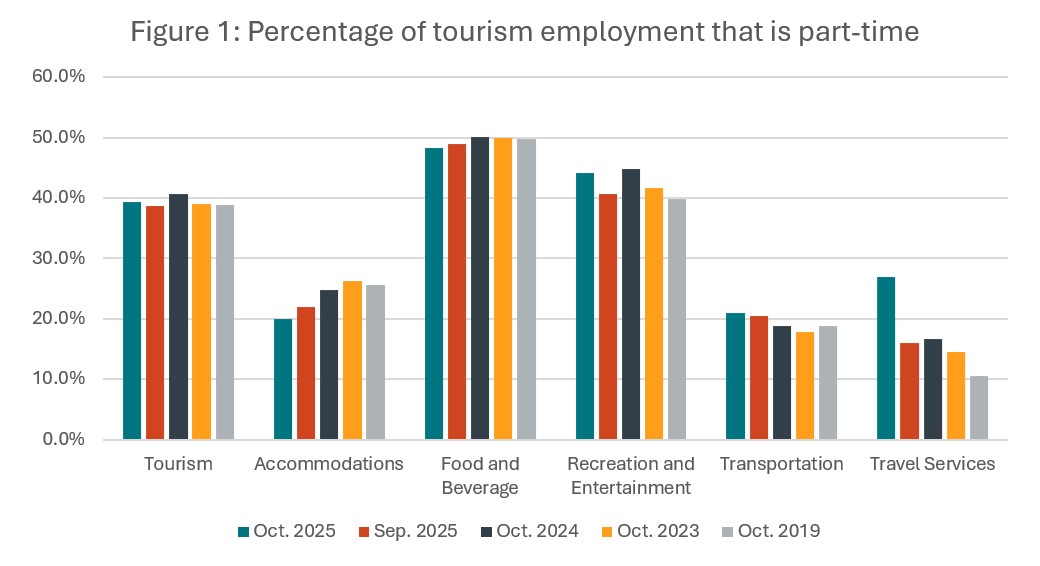
The ratio of part-time to full-time work provides an interesting perspective on the stability of the workforce, as different industries rely to different degrees on part-time work, but reducing hours remains a useful tool for businesses to retain their workforce during lean times.
Figure 1 shows that the overall ratio was little changed from September, and consistent relative to the last two years and to October 2019. This sector stability is a bit misleading, however, with accommodations showing a consistent reduction in the share of part-time workers, and recreation and entertainment and transportation showing overall increases. Travel services also reported a marked increase in October (relative to September and to previous years), but such large deviations in this industry group may be an effect of the sampling methodology of the Labour Force Survey. If this trend continues for several months, it may indicate a more systematic change.
Hours Worked
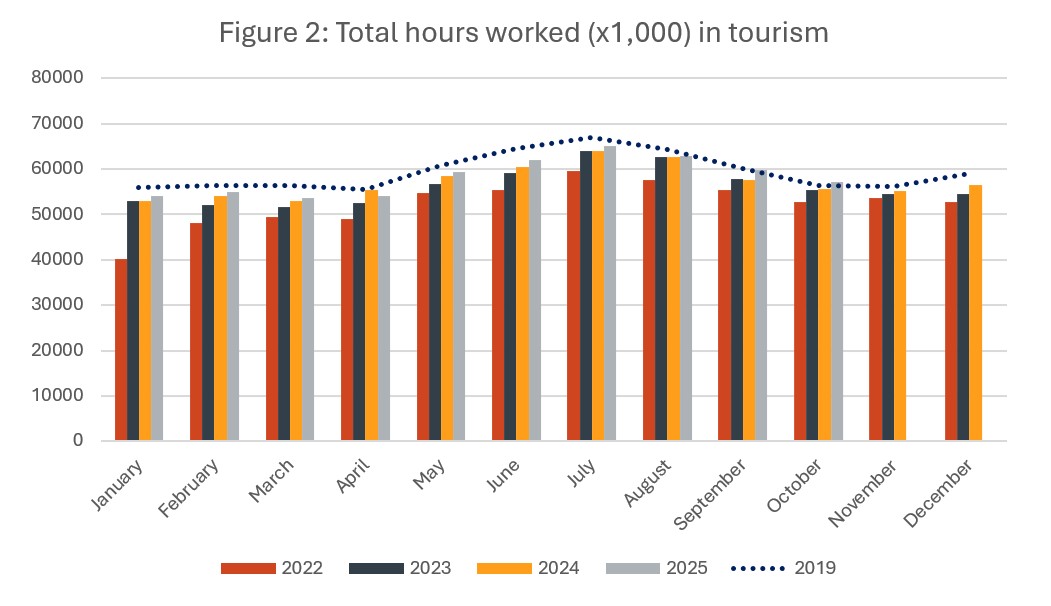
The number of hours worked provides another useful perspective on the stability of the workforce, in that this metric is more sensitive to short-term changes in tourism demand than employment figures in isolation. Total hours worked in tourism in October fell by around 4.5% from September, which is seasonally normal, but October 2025 hours worked were around 2.5% higher than last year, and 1.2% higher than they were in 2019. This marks the first time that pre-pandemic hours worked were surpassed.
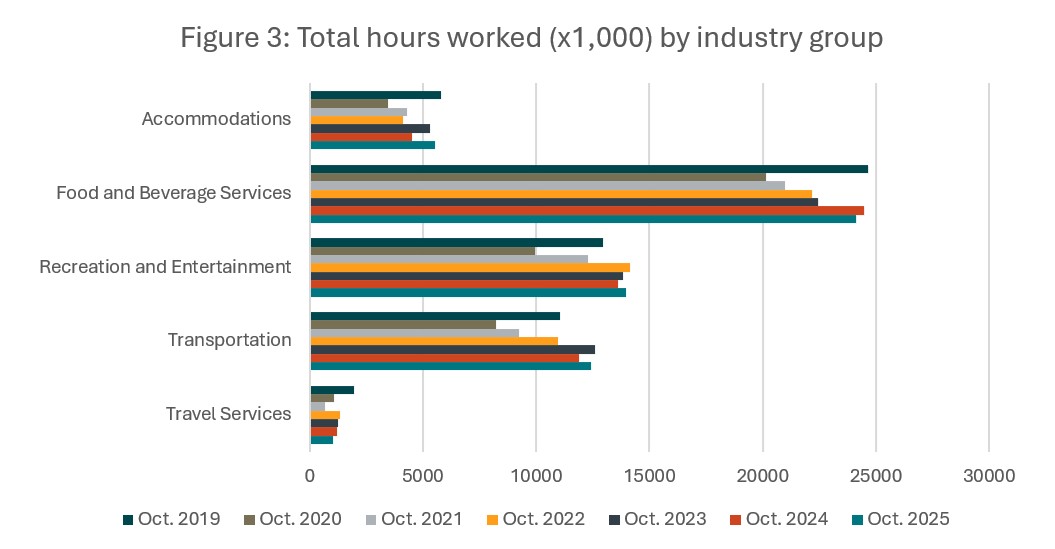
When disaggregated into industry groups and looked at on an annual basis (Figure 3), a more nuanced picture emerges. Recreation and entertainment and transportation were the only two industry groups that have actually surpassed their 2019 pre-pandemic baseline levels. Food and beverage services saw a decrease from last year of around 1.4%, as did travel services (-14.7%), while there were year-on-year gains in accommodations (+22.9%), recreation and entertainment (+2.7%) and transportation (+4.6%).
In many cases, October 2024 was a deviation from an otherwise fairly monotonic increase in hours worked from the low-point of the pandemic, suggesting that it may not be the best yardstick for looking at longer-term trends. Generally speaking, hours worked have been overall increasing since 2020, with the exception of travel services, but as noted elsewhere in the report, data for this industry group is prone to exaggerations in the magnitude of changes.
Industry Closeup: Accommodations
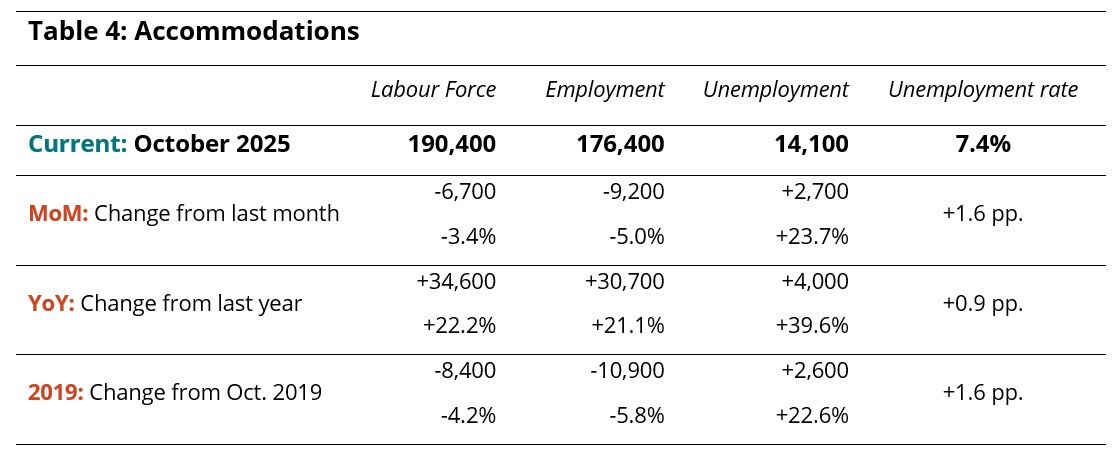
The accommodations industry saw gains across the summer, but began to lose workforce into autumn, a trend which continued in October (Table 4). Employment fell to 176,000 from September, while unemployment rose to 14,000, bringing the unemployment rate to 7.4%, which was also slightly higher than last year. Labour force and employment were stronger than last year, but both indices were lower than they were in 2019.
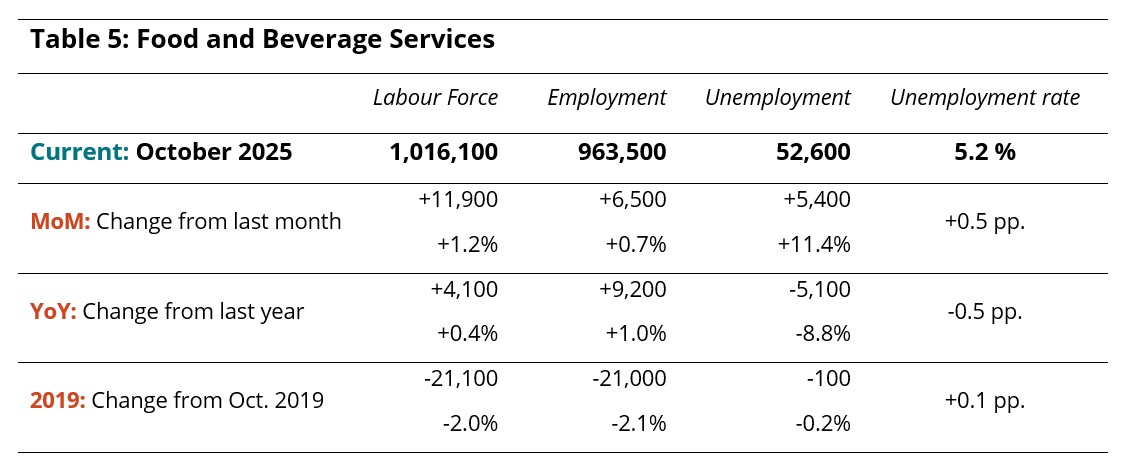
Industry Closeup: Food and Beverage Services
October saw a slight reversal of the labour losses noted in September, bringing employment up to 963,000 (Table 5). Unemployment also rose by 5,400, bringing the unemployment rate to 5.2%. Relative to last year, there were slight gains in both labour force and employment, while the sector remained around 21,000 below 2019 levels. The unemployment rate has remained fairly stable over these time frames.
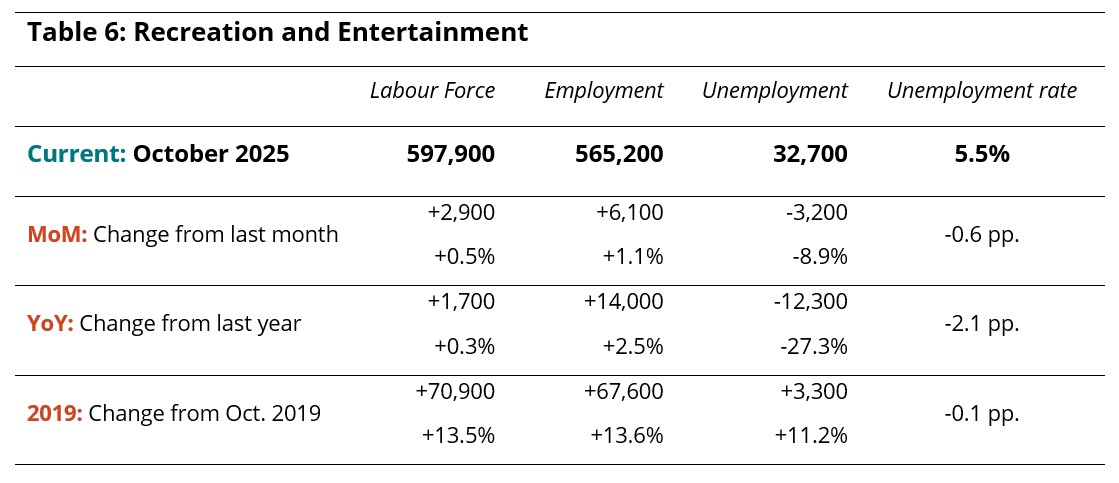
Industry Closeup: Recreation and Entertainment
Recreation and entertainment, which lost around 100,000 people in September, saw slight gains in October (Table 6). Employment rose to 565,000, while unemployment fell to around 33,000, bringing the unemployment rate down to 5.5%. The industry saw slightly higher employment than last year (+2.5%) and appreciably lower unemployment (with an unemployment rate 2.1 percentage points lower than in 2024), and substantially higher employment than 2019 (+13.6%).
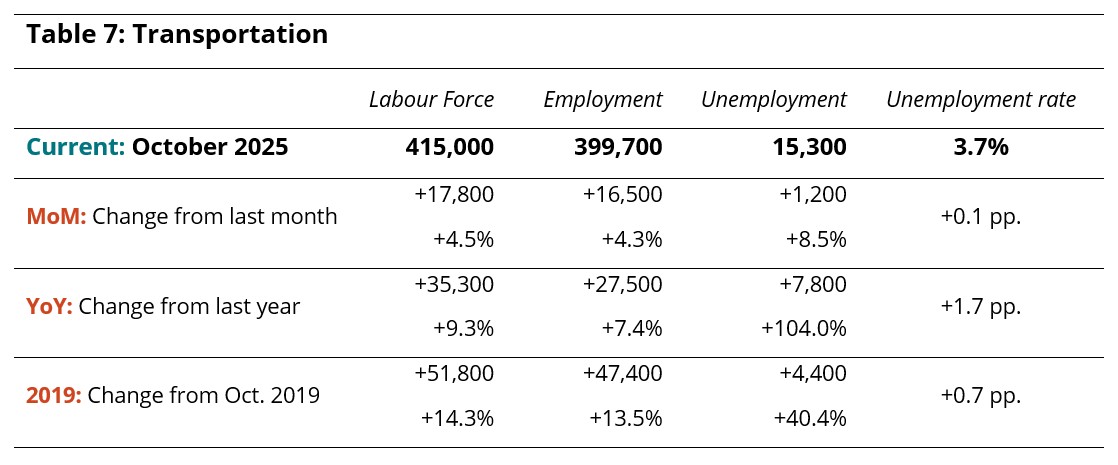
Industry Closeup: Transportation
Along with recreation and entertainment, the transportation industry group saw growth relative to last month, last year, and 2019, across both labour force and employment (Table 7). Gains from September were around 4%, gains from last year were around 8%, and gains over the pre-pandemic baseline were around 14%. The unemployment rate has crept up somewhat, driven by larger gains in labour force than in employment, but remains lower than any other tourism industry.
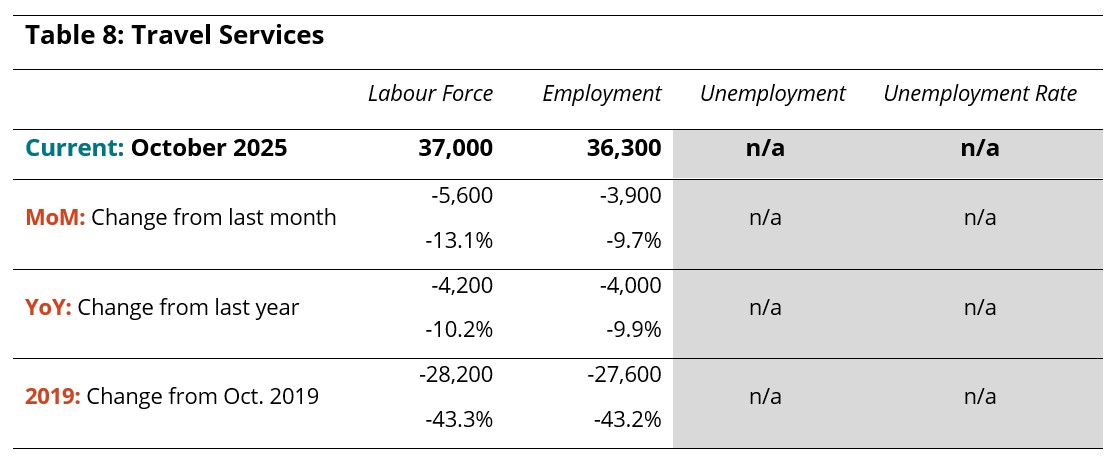
Industry Closeup: Travel Services
Data relating to the travel services industry group is not always reliable, due primarily to its small size relative to the LFS sample which can lead to substantial suppression in the raw data supplied by Statistics Canada. Because it is a small industry group, it is also prone to disproportionately large swings from month to month, particularly when things are considered as percentages. The data supplied in Table 8 provides some insights into the state of this industry, but should not generally be taken as a static snapshot of labour and employment, but rather as a broad indicator of trends. Overall, the industry remained substantially below 2019 levels in October, and continued to trend downward on a month-over-month basis.
Provincial Perspectives
The Canadian economy is subject to some pronounced regional differences, and that is particularly true in the tourism sector. Figure 4 provides a comparison of provincial unemployment rates, for the tourism sector in particular and for the total labour force (i.e., comprising all industries).
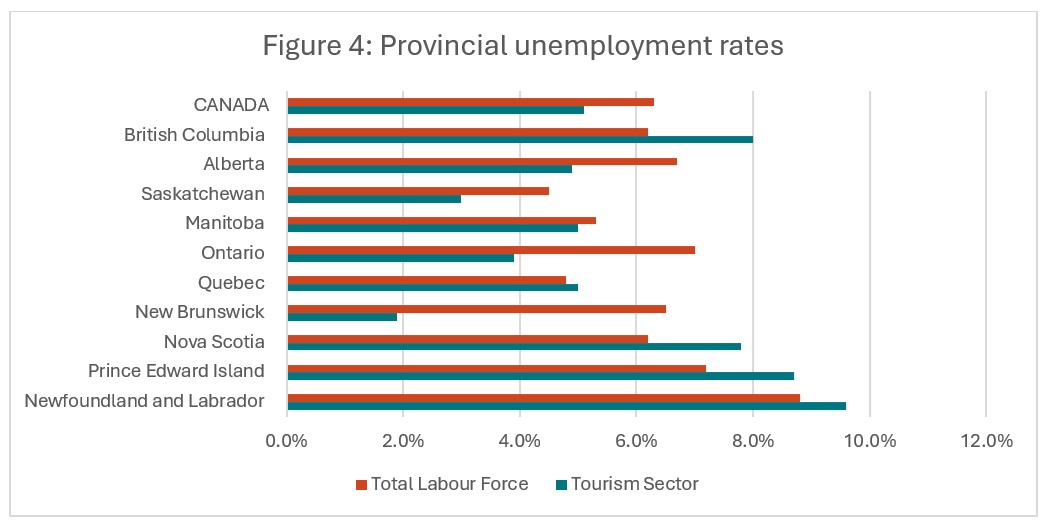
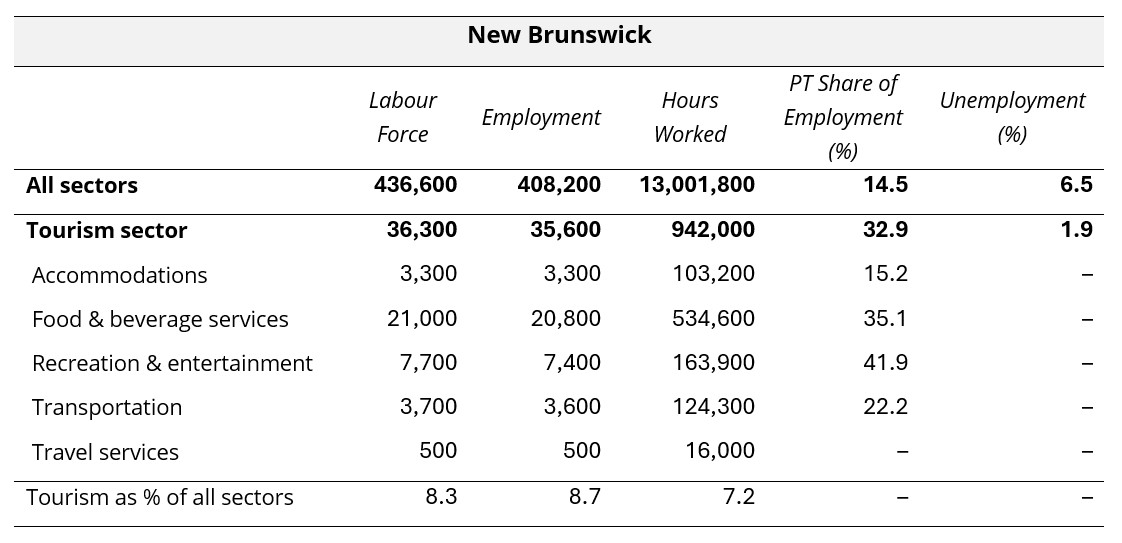
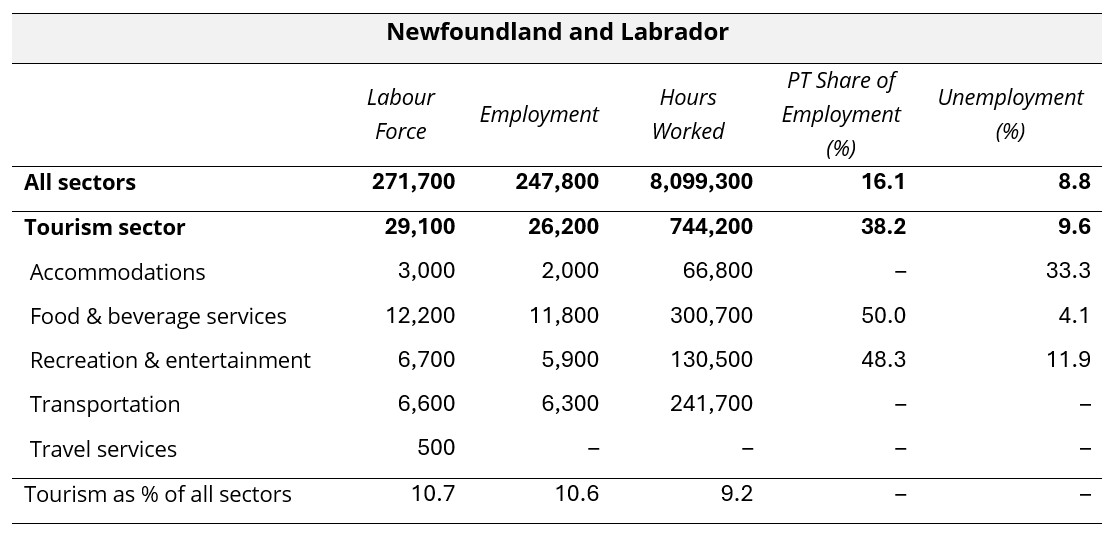
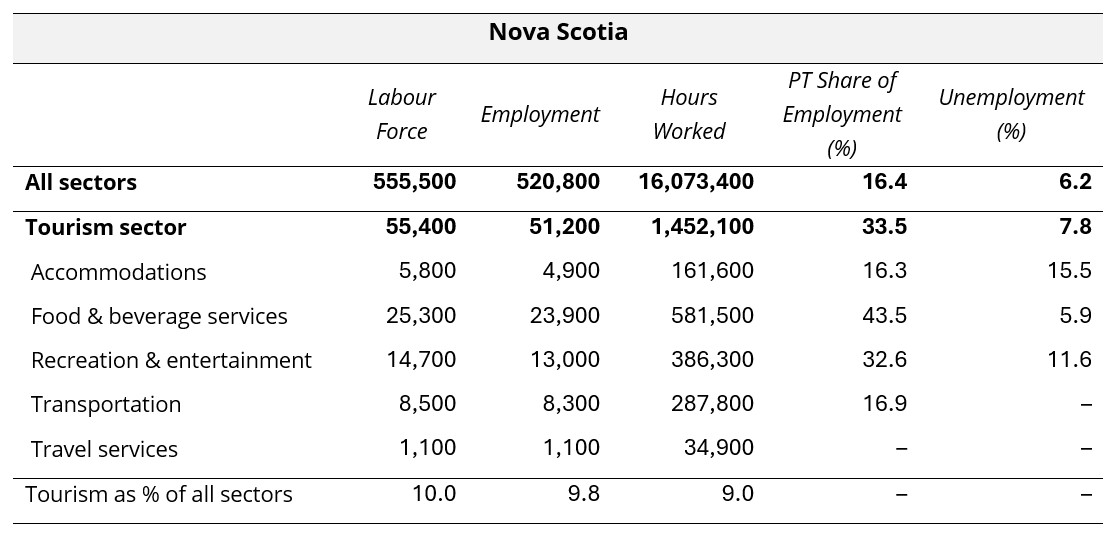
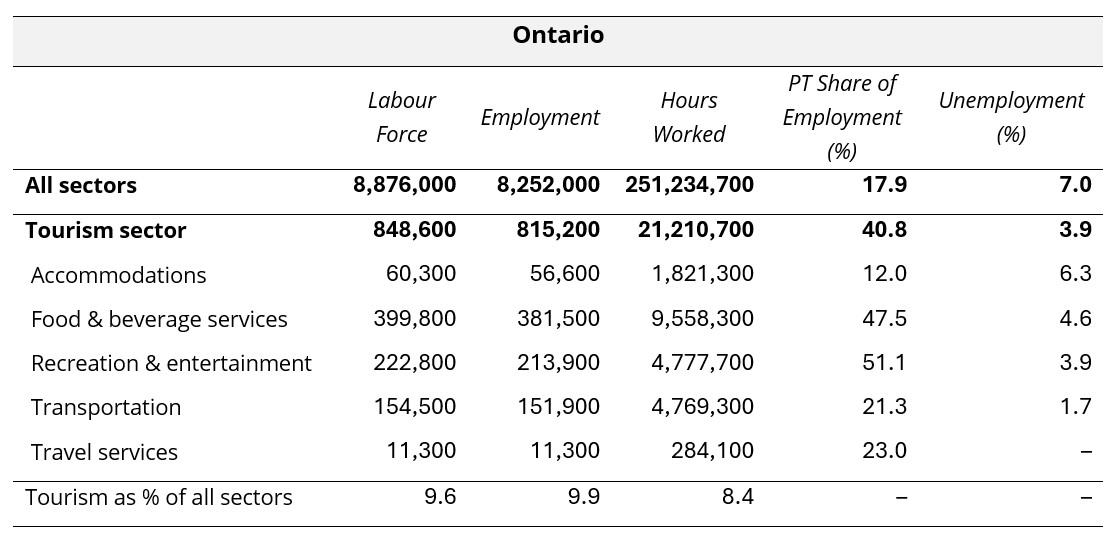
The unemployment rate in tourism was lower than that of the total labour force in several provinces in October, most compellingly in New Brunswick, where the difference was 4.5 percentage points. The tourism unemployment rate was higher than that of the broader provincial economy in British Columbia, Quebec, Nova Scotia, Prince Edward Island, and Newfoundland and Labrador. It is not uncommon for the Atlantic provinces to see tourism unemployment increase through autumn. Tourism unemployment rates were highest in Newfoundland and Labrador (9.6%) and Prince Edward Island (8.7%), and lowest in Saskatchewan (3.0%) and New Brunswick (1.9%).
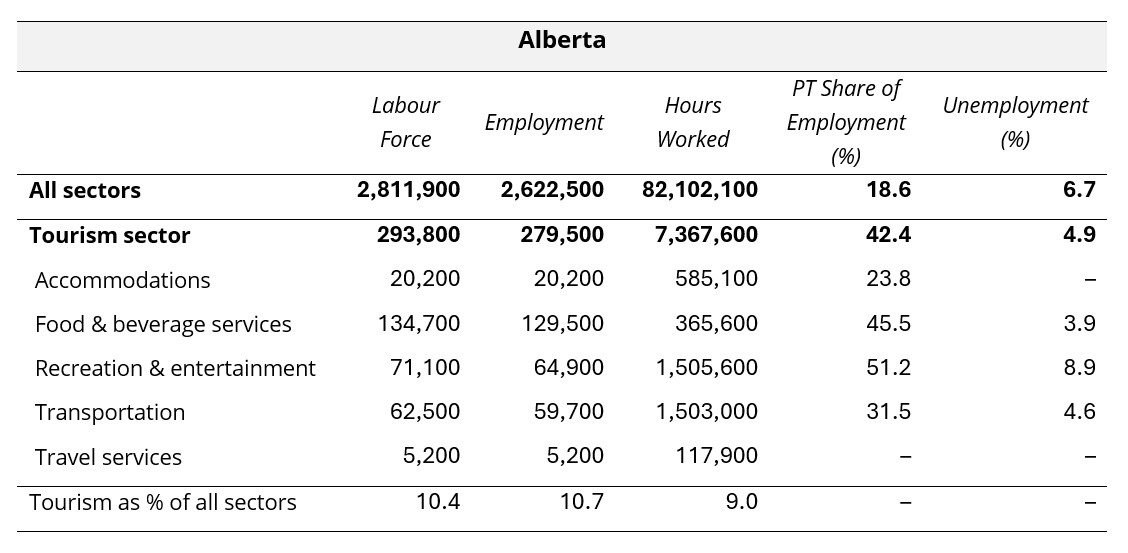
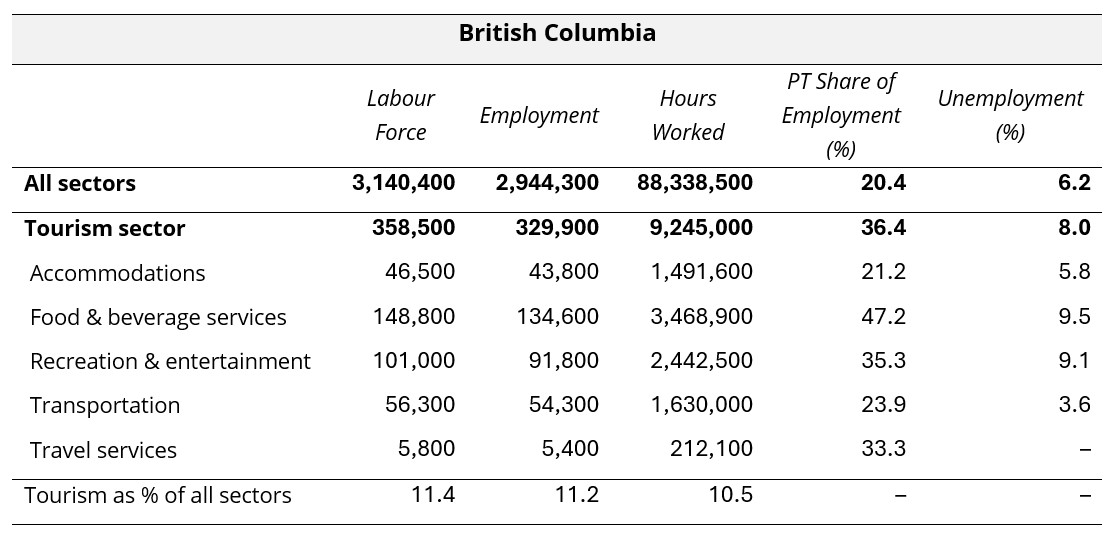
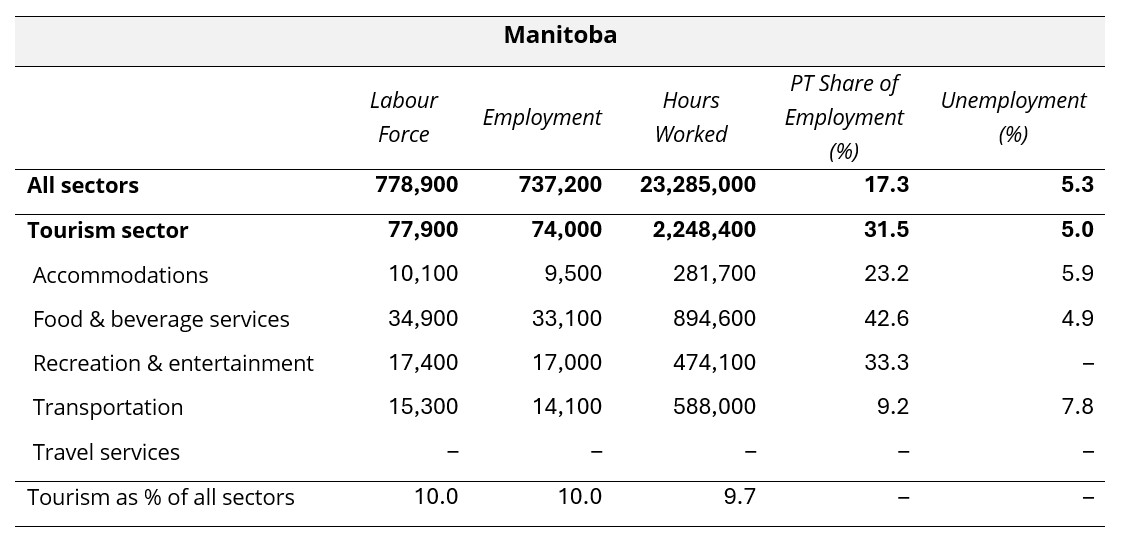
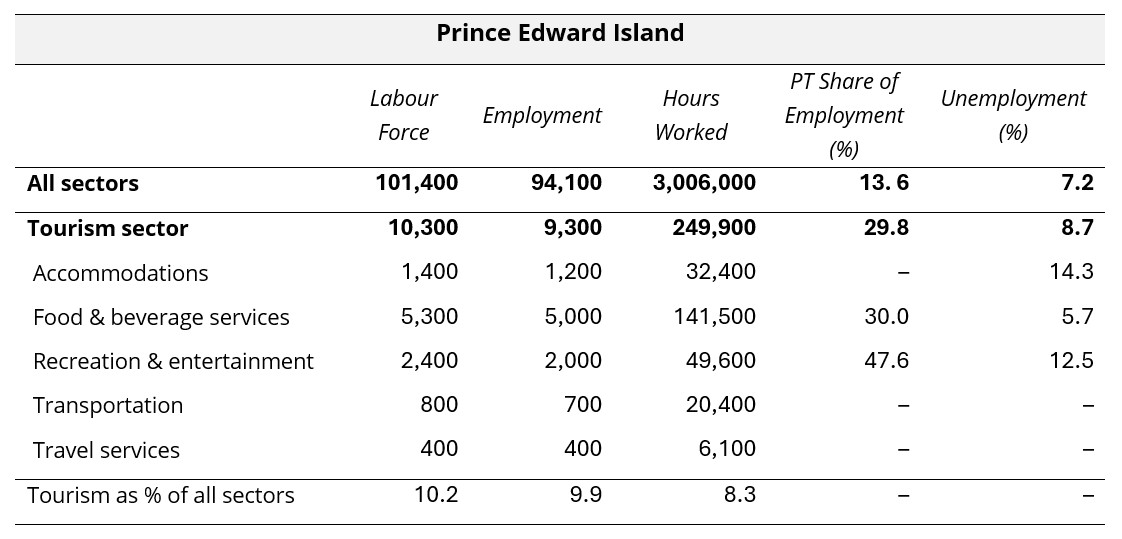
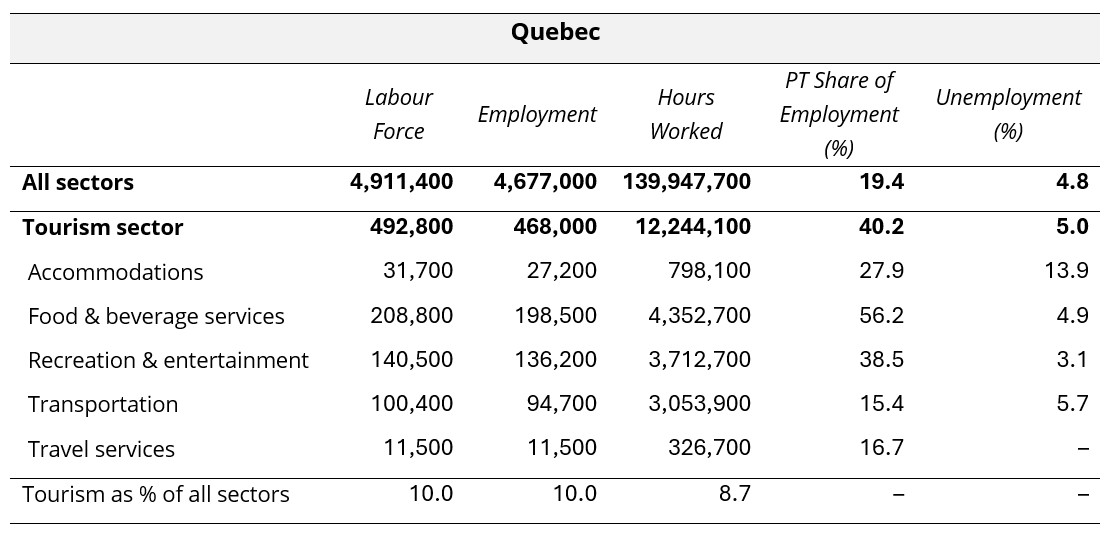
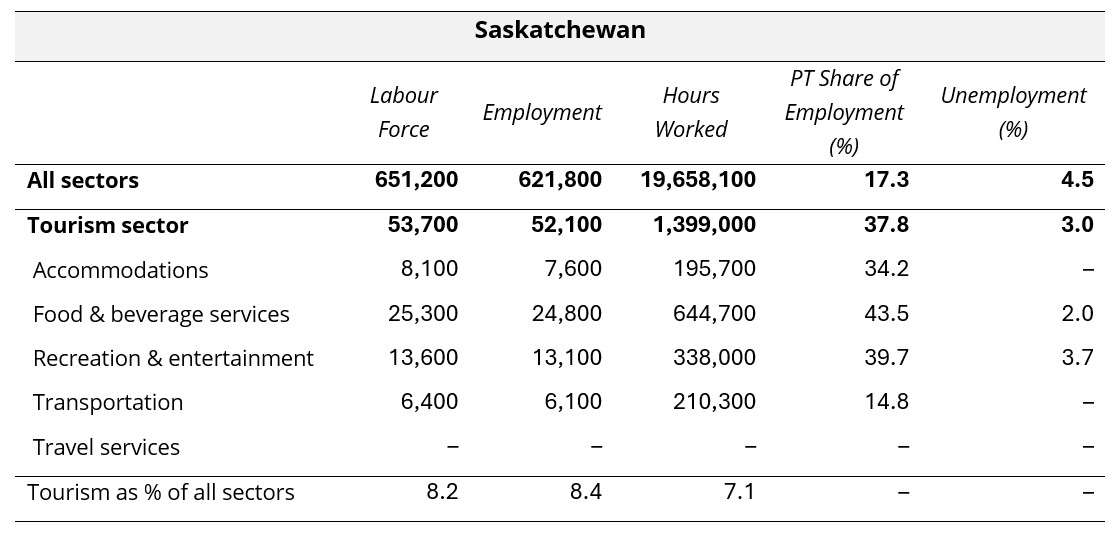
Provincial Summaries for October 2025
The following ten tables provide October 2025 summaries for the provinces, focusing on tourism and its five industry groups. Comparison data is provided for the larger provincial economy, as a benchmarking reference. Seasonally unadjusted estimates are provided for labour force, employment, and hours worked, and the final row of each table indicates tourism’s share of each of these metrics. The share of work that is part-time (as opposed to full-time) is also provided, as a rough indicator of the labour composition, as well as the unemployment rates.
Where data was not available due to suppression from Statistics Canada, “–” has been entered in the table. The three territories are not included in the LFS releases at this level of granularity, so no comparison is possible between the territories and the provinces. The provinces are listed alphabetically.
View more employment charts and analysis on our Tourism Employment Tracker.
[1] As defined by the Canadian Tourism Satellite Account. The NAICS industries included in the tourism sector those that would cease to exist or would operate at a significantly reduced level of activity as a direct result of an absence of tourism.
[2] SOURCE: Statistics Canada Labour Force Survey, customized tabulations. Based on seasonally unadjusted data collected for the period of October 12 to 18, 2025.