Tourism Stays the Course Through Autumn Lull.
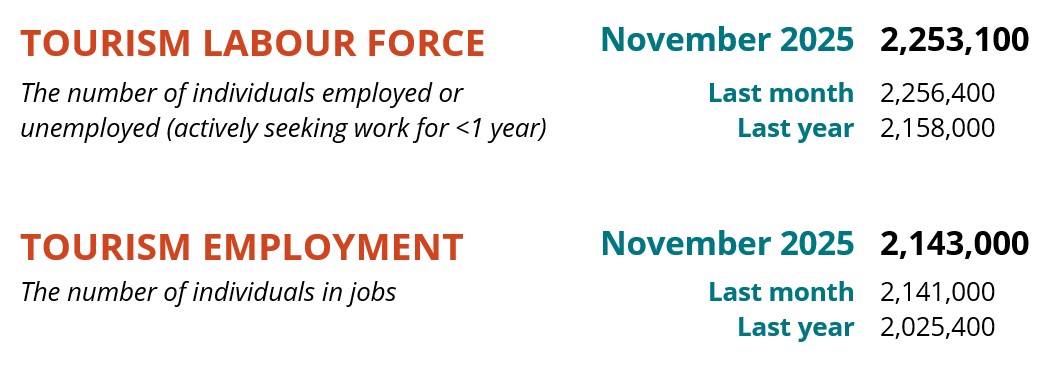
November is often a slow period in tourism, with the weather turning colder but not cold enough or snowy enough to support winter activities. The Canadian economy is still adjusting to new political and economic realities, and some households may be deciding to scale back discretionary spending in the run-up to the holiday season. In spite of these headwinds, the tourism sector[1] in November 2025 saw general stability from the previous month[2], with slight gains in employment countering slight losses in labour force.
At the industry group level, performance was varied, with growth in recreation and entertainment countering losses in accommodations, transportation, and, to a lesser extent, food and beverage services.
Table 1 provides a snapshot of each industry group’s performance across labour force, employment, and unemployment, as compared with October 2025 [MoM], November 2024 [YoY], and November 2019 as a pre-pandemic baseline. Small arrows represent changes of less than 1% (or one percentage point, in the case of unemployment).
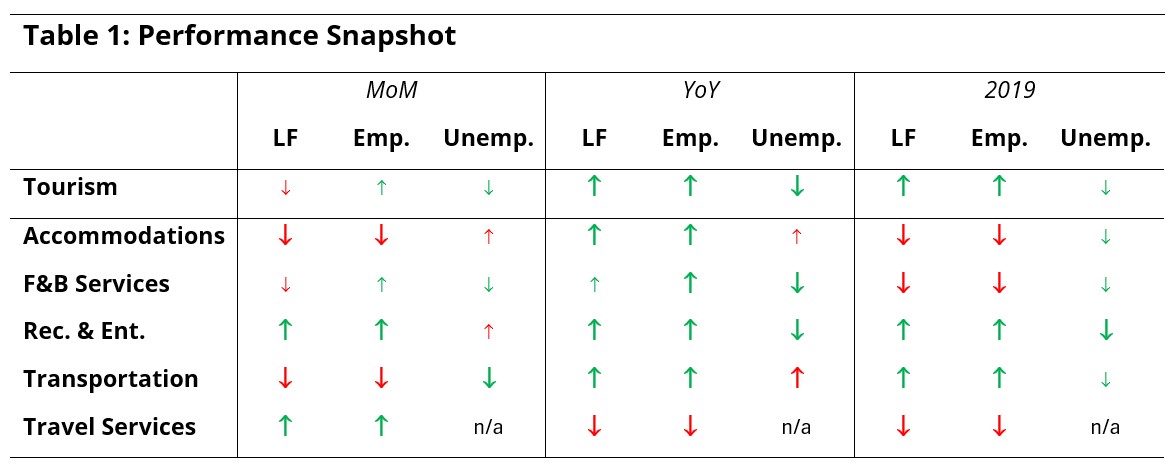
The sector overall was in a much stronger position than it was last year, with almost all industries showing substantial growth across both labour force and employment. Travel services reported losses, but this industry group’s data is not always entirely reliable. Relative to 2019, growth at the sector level was a result of strong performance in recreation and entertainment and in transportation, consistent with trends seen over the past year.
Tourism Sector
In November, tourism employment stayed around 2.1 million people (+2,000, +0.1%), while labour force remained at 2.2 million people (-3,300, -0.2%). Unemployment fell by around 5,300 people, bringing the unemployment rate down to 4.9% (-0.2 percentage points from October). Employment was around 118,000 higher than it was last year (+5.8% year-over-year), and around 88,000 higher than it was in 2019 (+4.3%). Table 2 provides a summary of the sector-level labour statistics.

Across all sectors of the Canadian economy, the unemployment rate was 6.2% (see Table 3), a slight decrease from 6.6% seen last month (calculated using seasonally unadjusted data). Both labour force and employment were basically unchanged from October.
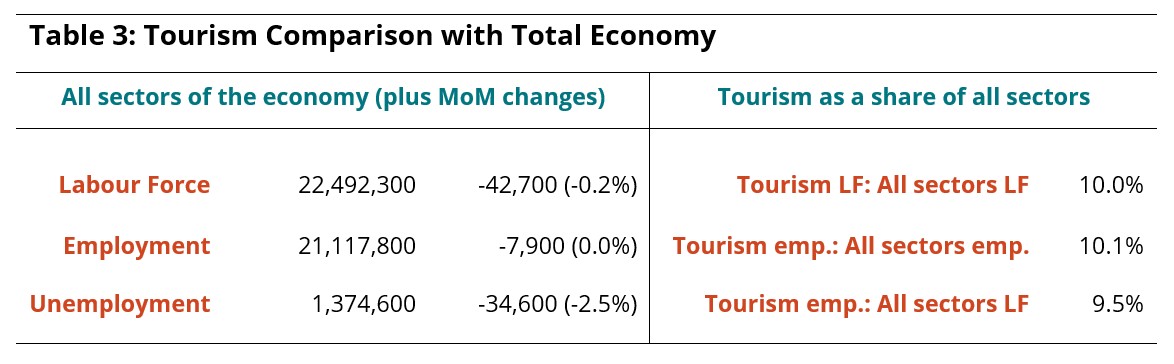
In November, tourism accounted for 10.1% of all employment in Canada, edging up slightly from October (+0.1 percentage point). Around 9.5% of the total Canadian labour force were working in tourism.
Part-Time and Full-Time Employment
Part-time work[3] increased as a share of all tourism employment in November, but only by around 1.5 percentage points, remaining generally steady around the 40% mark across the sector. This slight increase is more or less in line with observations across the broader economy, where employment gains have primarily been in part-time work. Unless this slight uptick marks the beginning of a larger trend, this is not necessarily a red flag, as the tourism sector has always been characterized by high and fluctuating rates of part-time employment. This index provides an interesting perspective on the stability of the sector, as businesses can more readily respond to shifts in consumer demand by modulating hours worked across their existing roster of employees than they can by taking on new staff or letting staff go.

Accommodations has continued to grow its full-time workforce, with November 2025’s part-time share of work having fallen by over 6 percentage points since 2019, and 2 percentage points since October. This signals that demand is high in this industry, and businesses are making do with a shrinking slate of employees.
Food and beverage services and recreation and entertainment both saw an increase in part-time work from October, which is unsurprising given the lull across the sector at this time of year. Transportation was little changed from October, and not far off where it was in 2019.
Travel services showed a drop from October, but month-over-month data for this industry group can be unreliable. More interesting is the substantial jump from pre-pandemic levels of part-time employment to the current state: 2019 saw less than 10% of the travel services workforce being part-time, which has increased to nearly a quarter in 2025. More focused research is needed to fully analyse the causes and implications of this shift, but it is likely due in large part to the increased ease of self-directed online travel arrangements, and potentially the role of AI in designing bespoke travel itineraries.
Hours Worked
Another useful metric to assess the stability of tourism employment is the estimate of total hours worked, which allows us to triangulate across employment numbers and part-time work share. As shown in Figure 2, tourism saw a slight increase from October in hours worked (+1.3%), and a more substantial increase from last year (+5.0%). Total hours worked surpassed 2019 levels for the first time in September, and remained elevated (+3.2%) in November.

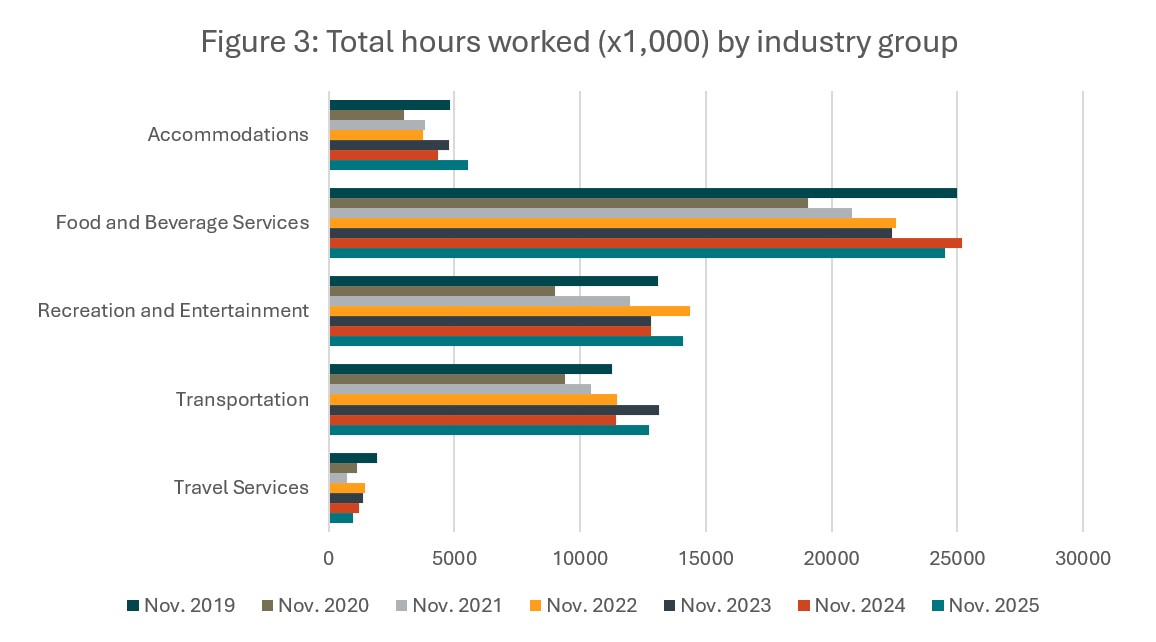
At the industry group level, through a year-over-year lens (Figure 3), hours worked in accommodations grew substantially from last year, and in fact surpassed 2019 levels. In food and beverage services, hours worked fell from last year, although generally continued the trend of the past five years of regrowth since the pandemic. Recreation and entertainment and transportation both saw year-over-year gains, and travel services saw a moderate drop, but this may not be entirely representative of the industry.
Industry Closeup: Accommodations
The accommodations industry contracted by about 4% from October, bringing labour force to 183,000 people and employment to 169,400 (Table 4). Unemployment sat at 7.5% in November, a marginal increase on October’s rate. Both labour force and employment were around 14% larger than they were last year, but the industry remained slightly below 2019 levels.

Industry Closeup: Food and Beverage Services
The unemployment rate in food and beverage services fell to 4.5% in November, through an additional 5,700 people finding employment while 1,200 left the labour force (Table 5). Employment stood at 969,200 people across the country, having gained around 17,000 workers in the past year. The industry remained around 23,000 workers below where it was in 2019, while its labour force was around 31,000 lower.

Industry Closeup: Recreation and Entertainment
Recreation and entertainment gained around 8,000 workers in November, bringing its employment figures to nearly 574,000, and its labour force to around 612,000 (Table 6). Unemployment rose by 5,400 people, bringing the unemployment rate up to 6.2%. The industry was in a much stronger position this year than last, with over 50,000 more workers finding employment; likewise, employment was nearly 90,000 stronger than it was in 2019.

Industry Closeup: Transportation
Both labour force (-11,000) and employment (-6,500) fell for transportation from October, the balance of which pulled the unemployment level down to 2.6% in November (Table 7). Employment stood at 393,200 people, while labour force had lowered to around 404,000. Both labour force and employment were stronger this year than last year (around +9%), and also stronger than in 2019 (around +13%).

Industry Closeup: Travel Services
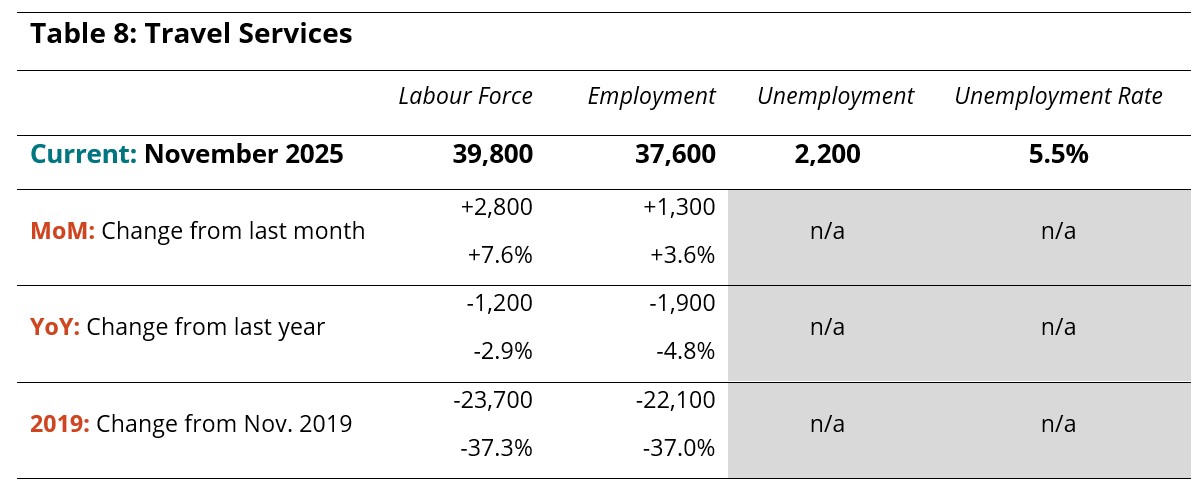
Labour Force Survey data related to travel services is not always reliable, because of its size relative to the total tourism sector, and to the larger economy. Small numbers are prone to distortion when converted to percentages, and this industry group is not well represented in the sample population of the survey to begin with.
The data supplied in Table 8 provides some insights into the state of the industry, but is better understood in relation to long-term changes rather than a realistic estimate of the current labour context. Overall, travel services remained substantially below where it was in 2019, and changes from last month and last year were relatively small fluctuations.
Provincial Perspectives
The Canadian economy is subject to some pronounced regional differences, and that is particularly true in the tourism sector. Figure 4 provides a comparison of provincial unemployment rates, for the tourism sector and for the total labour force (i.e., comprising all industries).

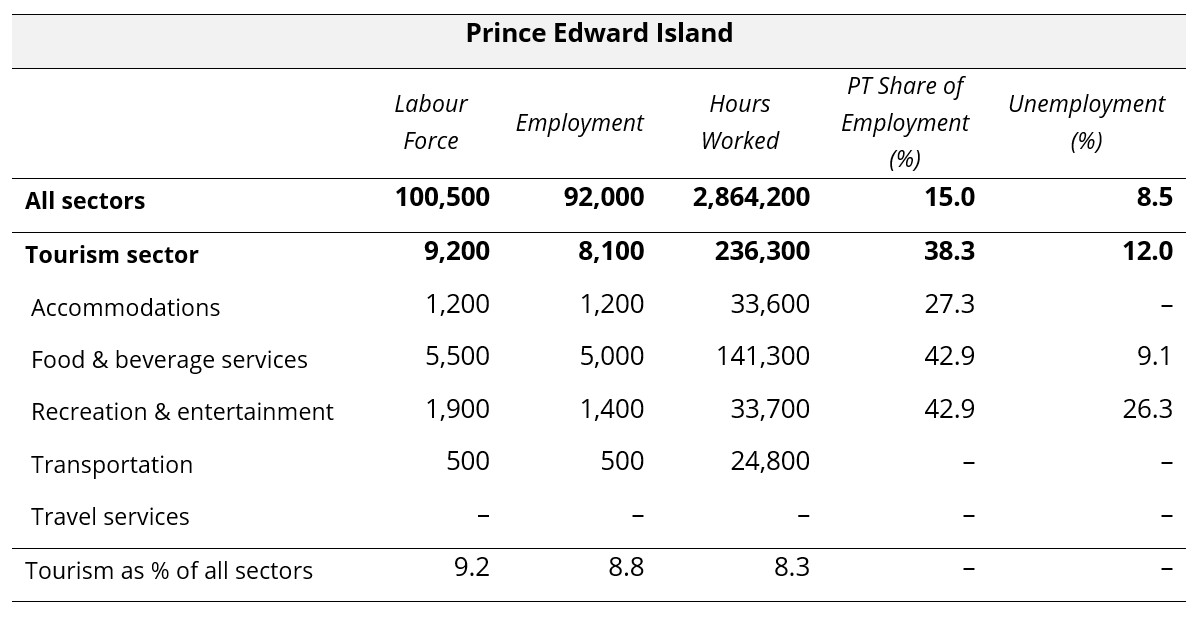
The unemployment rate in tourism was generally lower than it was for the broader provincial economies, with the exception of three of the Atlantic provinces (Nova Scotia, Prince Edward Island, and Newfoundland and Labrador), which maintained the autumnal pattern noted in October. Tourism unemployment rates were highest in Prince Edward Island (12.0%) and Newfoundland and Labrador (11.6%), and lowest in Alberta (2.5%) and Manitoba (4.3%).
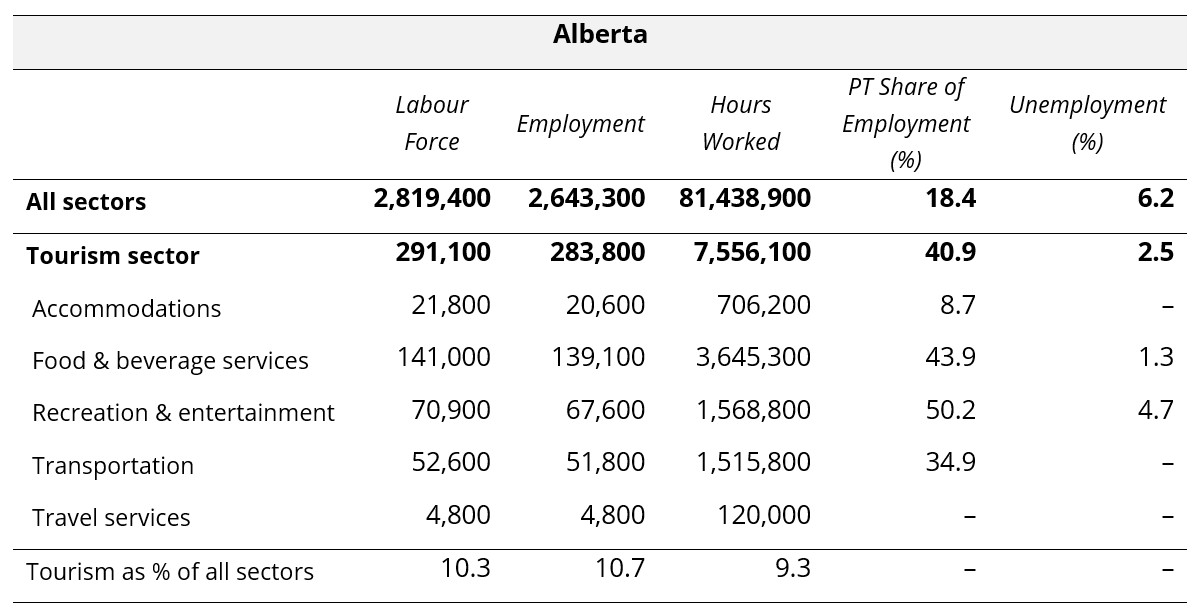
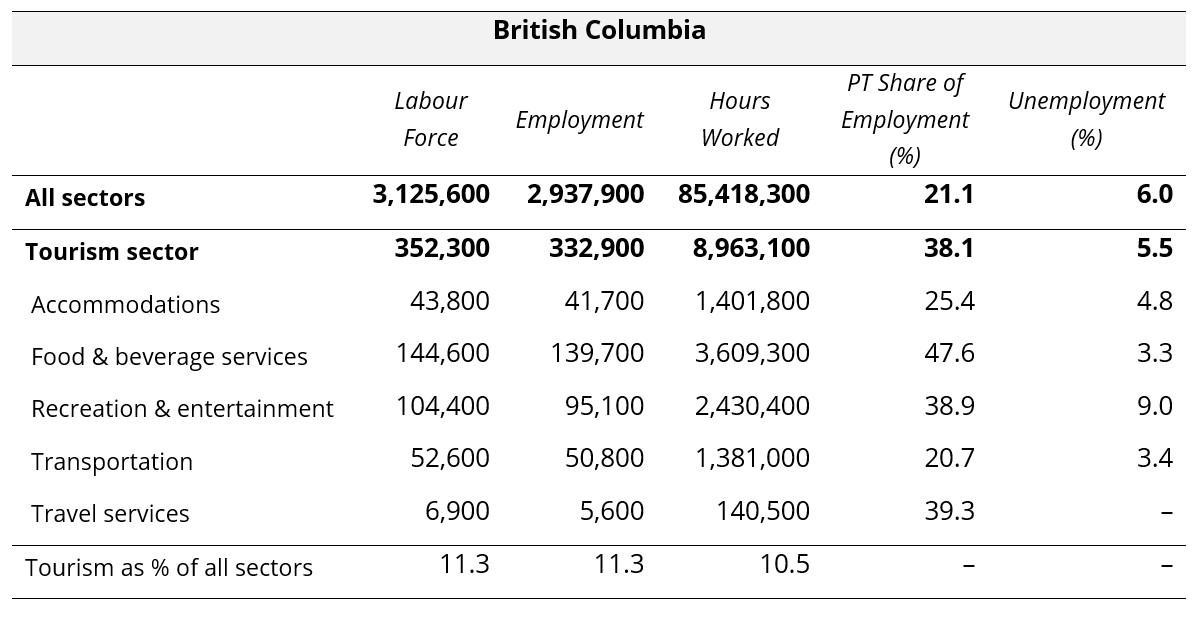
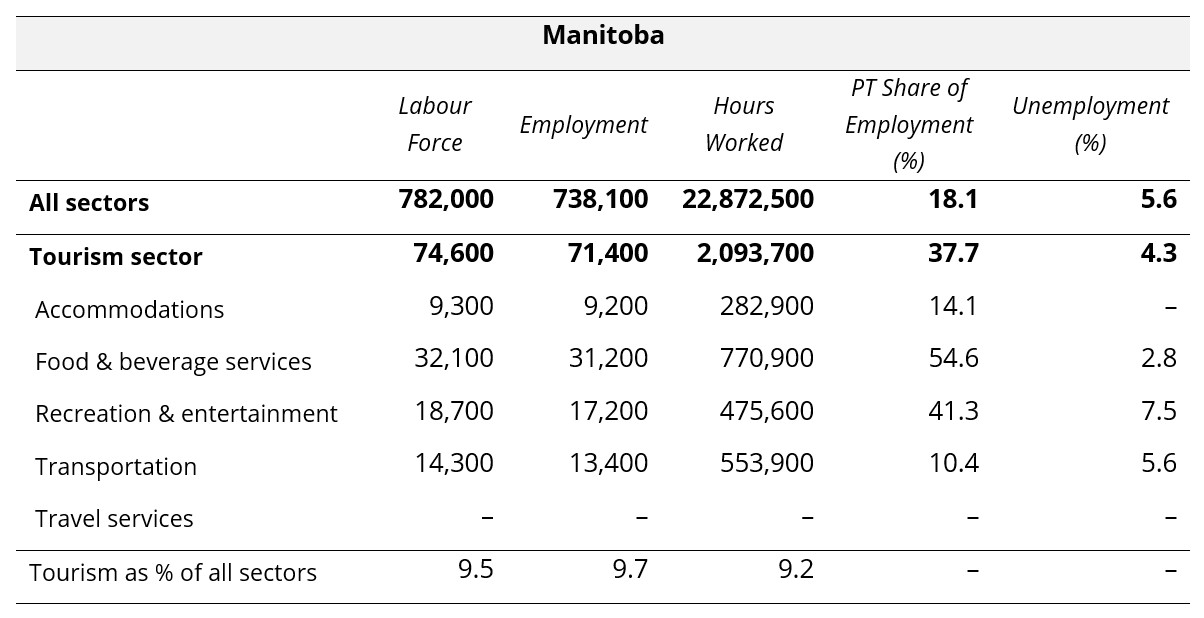
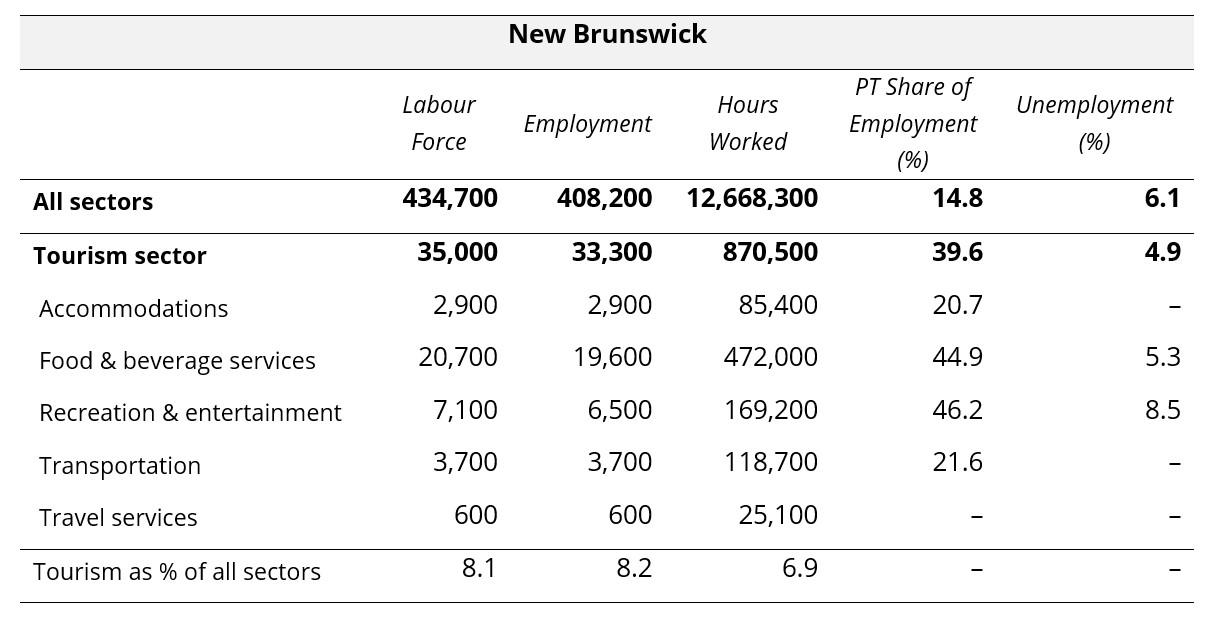
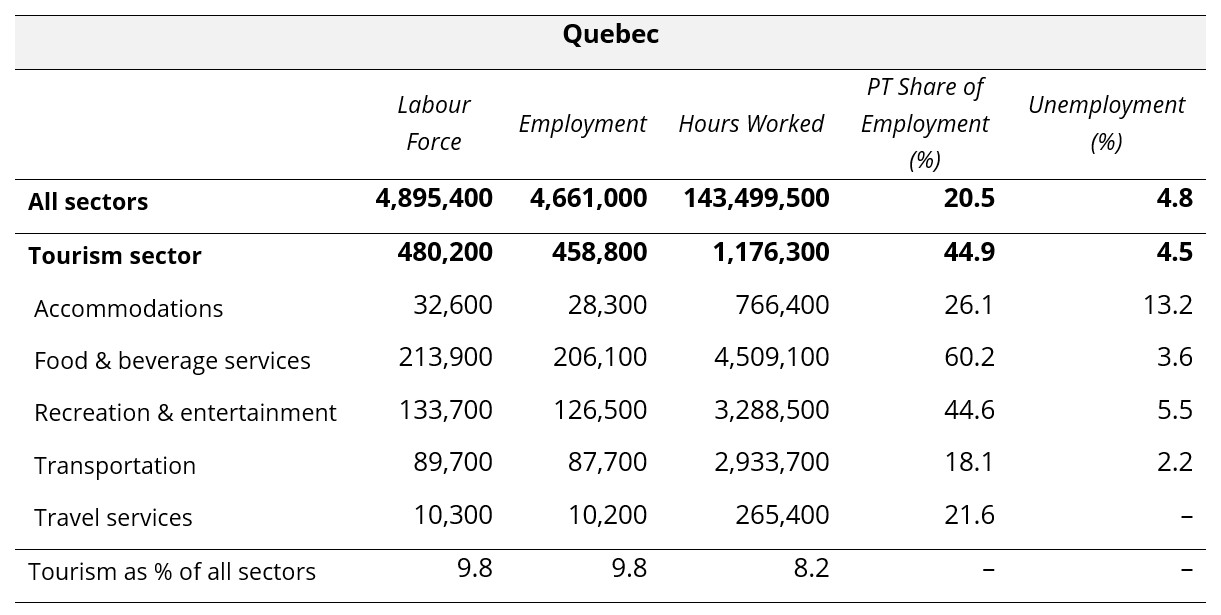
Provincial Summaries for November 2025
The following ten tables provide November 2025 summaries for the provinces, focusing on tourism and its five industry groups. Comparison data is provided for the larger provincial economy, as a benchmarking reference. Seasonally unadjusted estimates are provided for labour force, employment, and hours worked, and the final row of each table indicates tourism’s share of each of these metrics. The share of work that is part-time (as opposed to full-time) is also provided, as a rough indicator of the labour composition, as well as the unemployment rates.
Where data was not available due to suppression from Statistics Canada, “–” has been entered in the table. The three territories are not included in the LFS releases at this level of granularity, so no comparison is possible between the territories and the provinces. The provinces are listed alphabetically.


View more employment charts and analysis on our Tourism Employment Tracker.
[1] As defined by the Canadian Tourism Satellite Account. The NAICS industries included in the tourism sector those that would cease to exist or would operate at a significantly reduced level of activity as a direct result of an absence of tourism.
[2] SOURCE: Statistics Canada Labour Force Survey, customized tabulations. Based on seasonally unadjusted data collected for the period of November 9 to 15, 2025.
[3] Statistics Canada defines full-time work as 30 hours per week, and part-time work as less than 30 hours per week.