Accommodations Sees Losses Against Sector Growth.
The tourism sector[1] in February 2026 saw slight gains over the previous month[2], with labour force growth outpacing employment, pulling the unemployment rate up slightly. Across the broader national economy, labour force edged up and employment edged down, so tourism outperformed the aggregate economy in relative terms.
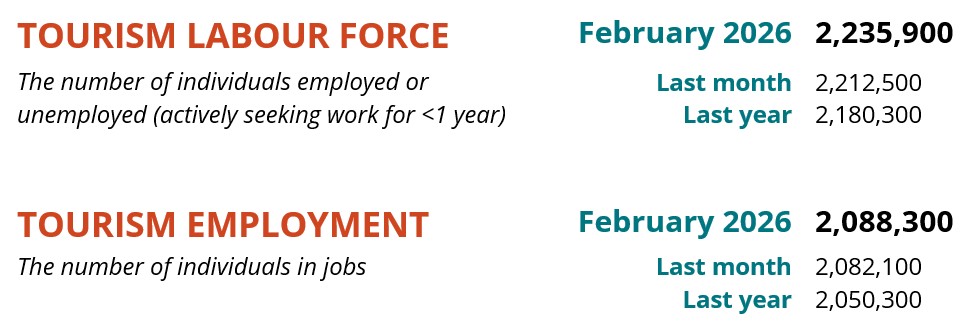
Table 1 provides a snapshot of each industry group’s performance across labour force, employment, and unemployment, as compared with January 2026 [MoM], February 2025 [YoY], and February 2019 as a pre-pandemic baseline. Small arrows represent changes of less than 1% (or one percentage point, in the case of unemployment).

At the industry group level, month-over-month changes were broadly positive, although accommodations saw declines from January—but gains relative to last year—while food and beverage services grew over the past month but lost ground relative to February 2025.
The sector as a whole saw growth over 2019 levels, although that was driven entirely by growth in recreation and entertainment and in transportation, following a general trend over the past year or so. Travel services reported some substantial losses, but as is always the case, this industry group is not well-served by the sampling methodology of the Labour Force Survey, so these observations should be viewed with some skepticism.
Tourism Sector
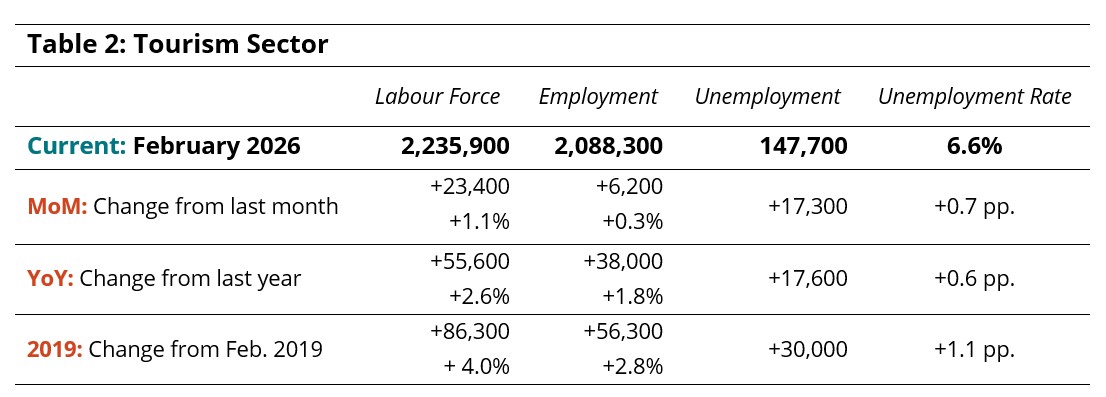
The tourism labour force in February saw around 23,000 new entrants, although that only translated to 6,000 new people in employment, meaning that unemployment rose by 17,000 people at the same time, bringing the unemployment rate across the sector to 6.6%. Both employment and labour force grew from last year, and were considerably higher than in 2019 as well. Table 2 provides a summary of sector-level labour statistics.
Across all sectors of the Canadian economy, labour force grew by less than the tourism sector’s labour force grew (in both absolute and relative terms), while employment dipped by 0.1% (see Table 3). The economy-wide unemployment rate was 6.9%, remaining slightly higher than that seen in tourism.
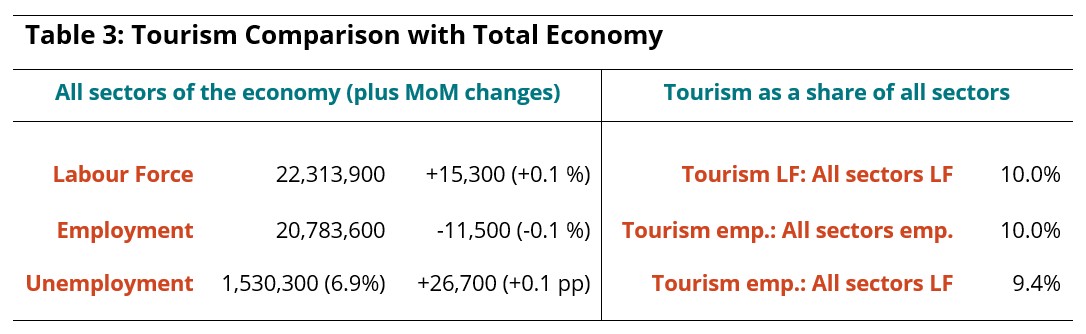
Tourism employment accounted for 10.0% of all employment in Canada, with 9.4% of the total Canadian labour force working in tourism.
Part-Time and Full-Time Employment
The ratio of part-time[3] to full-time work can provide useful insights into the stability of the workforce. Tourism typically has a fairly high share of part-time workers, with seasonal variation. We saw substantial disruptions to this pattern over the course of the pandemic and the subsequent waves of reopening, and as the sector continues to respond to changing geopolitical pressures that affect discretionary spending and international travel plans, this indicator may be an early-warning system of more changes to the system.

Figure 1 shows the share of tourism employment that is part-time, with reference to this year, last month, the previous two years, and 2019 as a pre-pandemic baseline. This February saw a spike in part-time work, carried primarily by food and beverage services (which is the largest employer group in the sector), although most industries saw a similar shift. Recreation and entertainment saw a very slight decrease, but for the past few years it has had consistently higher rates of part-time work than during the pre-pandemic period.
Hours Worked
Another useful snapshot on employment stability is the number of hours worked. In tourism businesses that rely to a large extent on part-time workers, one of the quickest ways to respond to changes in customer demand is to give your current roster of employees more or fewer shifts per week, or longer or shorter shifts. This shows up in the total hours worked, which is presented in Figure 2 at a sector level and in Figure 3 at an industry group level.
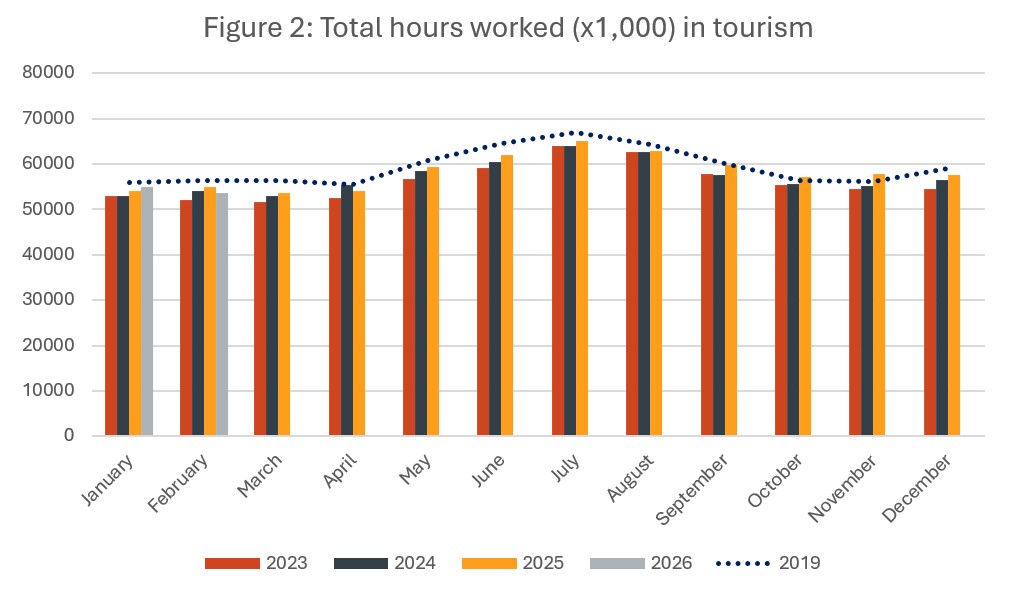
Total hours worked in tourism fell slightly from January (-2.2%), while employment rose very slightly, indicating an overall reduction per worker (although this is unlikely to be evenly distributed across the entire workforce). This February’s total was also lower than last year’s, and also lower than in 2019 (-4.7%).

At the industry group level (Figure 3), looking only at year-over-year changes, the industry groups have shown different trajectories of recovery. Accommodations has been gradually building up hours towards 2019 levels, but this growth has slowed considerably in the last two years. Food and beverage services has also been gradually growing back to pre-pandemic strength, but it is likely that the high levels seen in 2025 were spurred on by the GST tax holiday enacted temporarily by the federal government, which increased traffic to restaurants. Hours worked in recreation and entertainment have been fairly steady since the dip in 2021, but it should be noted that this relative stability is against a generally increasing number of employees, suggesting that workers are (on average) working fewer hours, which corresponds with the shift towards more part-time work noted above. Transportation, which has also seen fairly consistent employment growth over the past few years, has likewise seen a fairly consistent increase in hours worked. Data relating to travel services is not always entirely reliable, but the consistency of the hours worked since 2020 reflects this industry’s difficulties in regaining lost ground.
Industry Closeup: Accommodations
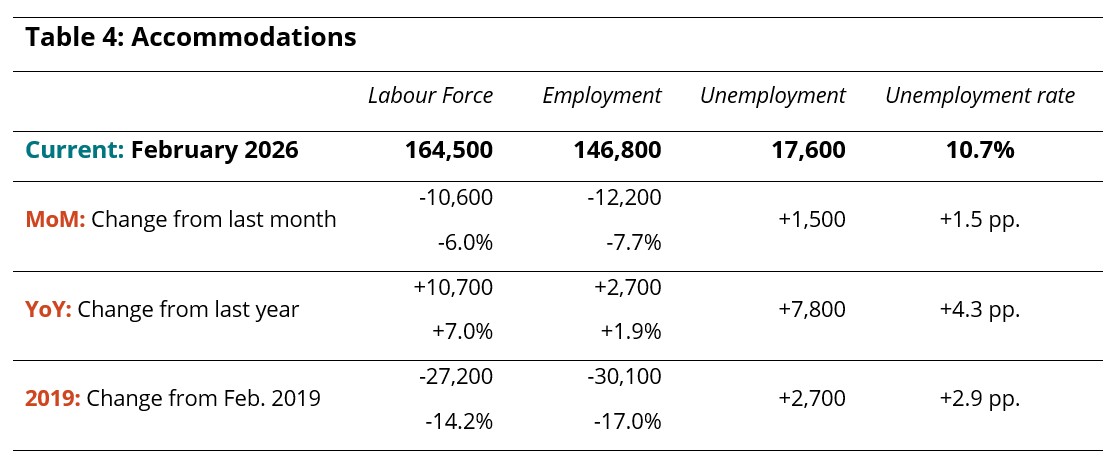
Continuing the trend noted in January, accommodations saw losses across both labour force and employment (Table 4), with around 12,000 people leaving jobs in the industry in February. Unemployment rose to 10.7%, which was not only higher than last month but also higher than last year and 2019. Relative to last year, both employment and labour force were elevated, but the sector remained substantially below where it was before the pandemic.
Industry Closeup: Food and Beverage Services
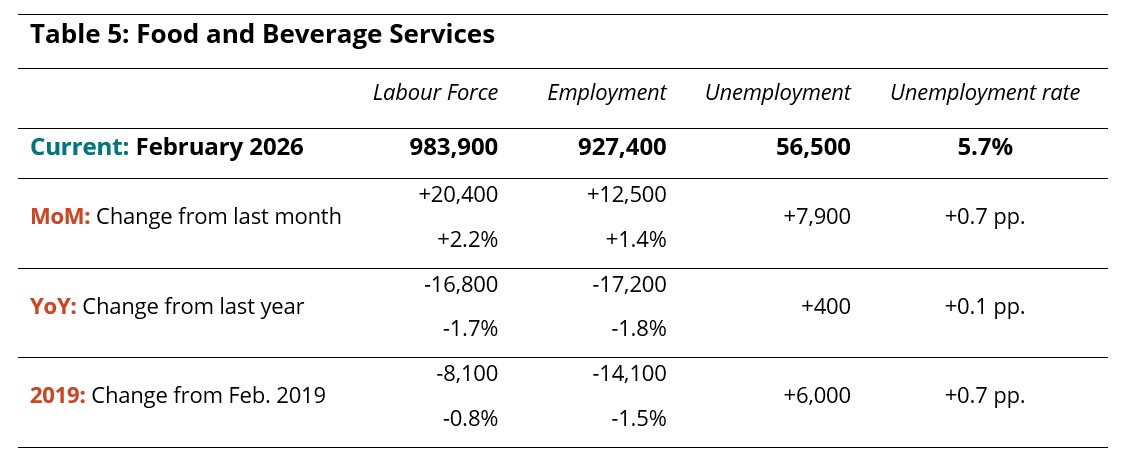
Food and beverage services saw some gains from January (Table 5), with around 20,000 people entering the labour force, and 12,000 finding employment. However, the sector remained lower than last year, and lower than in 2019, across both indices.
Industry Closeup: Recreation and Entertainment
Recreation and entertainment continued its general pattern of growth in February (Table 6), across both labour force and employment, bringing employment up to 575,000 people across the country. Both indices were higher than last year (by around 3%), and substantially higher than 2019 (by around 15%). This industry has consistently led post-pandemic recovery in terms of employment, but as noted above (Figure 3), hours worked have not grown in the same way and there has been a shift towards greater part-time work.

Industry Closeup: Transportation
Transportation continued to see growth in February (Table 7), albeit at a less accelerated pace than it has in the past, or indeed to a lesser extent than recreation and entertainment. Employment rose to just over 400,000 across Canada, with the unemployment rate staying low at 3%. The labour market in the industry was around 10% bigger than it was in February 2025, and around 11% bigger than in 2019.

Industry Closeup: Travel Services
As noted previously, LFS data for travel services is often unreliable, and prone to disproportionately large swings from month to month. This is partly due to the sampling methodology of the LFS itself, and equally due to the relatively small size of this industry within tourism, and indeed within the larger economy. Substantial swings suggest either extreme volatility in the industry group or sampling errors; in the case of this industry, it is almost certainly a sampling issue. The data as reported is presented in Table 8, but should be used cautiously in estimating this segment of the workforce.

Provincial Perspectives
The Canadian economy is subject to some pronounced regional differences, and that is particularly true in the tourism sector. Figure 4 provides a comparison of provincial unemployment rates, for the tourism sector in particular and for the total labour force (i.e., comprising all industries).
With tourism in its canonically slow season, it’s unsurprising to find that in most provinces, tourism unemployment rates were higher than those of their economy-wide provincial averages. The exceptions were Alberta, Saskatchewan, and Ontario. It’s not clear whether is related to the strength of the tourism sector, or to larger challenges in the broader economies in question.
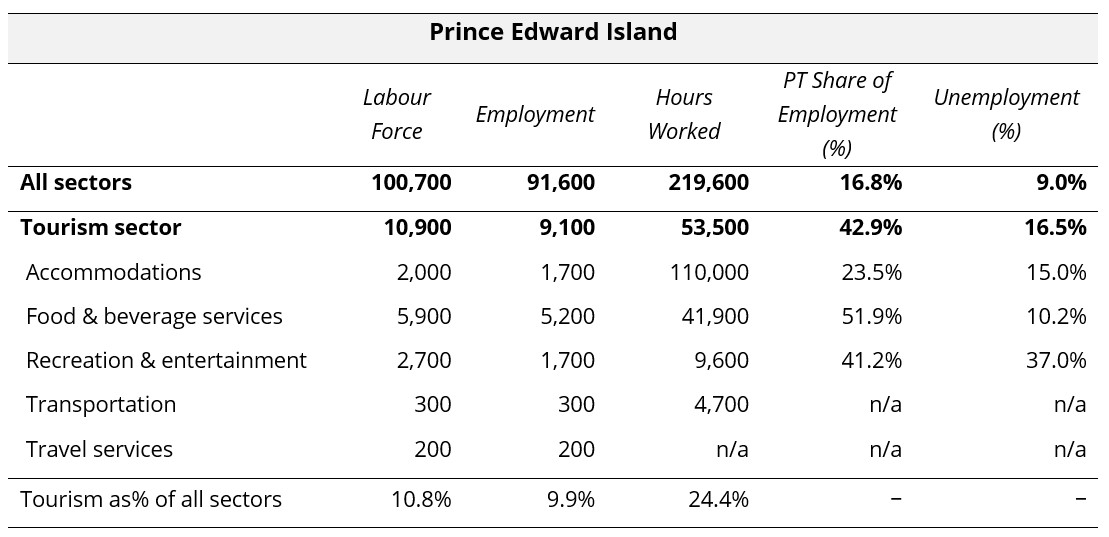
Provincial tourism unemployment rates were highest in Atlantic Canada, with Prince Edward Island (16.5%) and Newfoundland and Labrador (15.7%) having substantially higher rates than anywhere else. Provincial tourism unemployment rates were lowest in Saskatchewan (4.4%) and Ontario (5.0%).

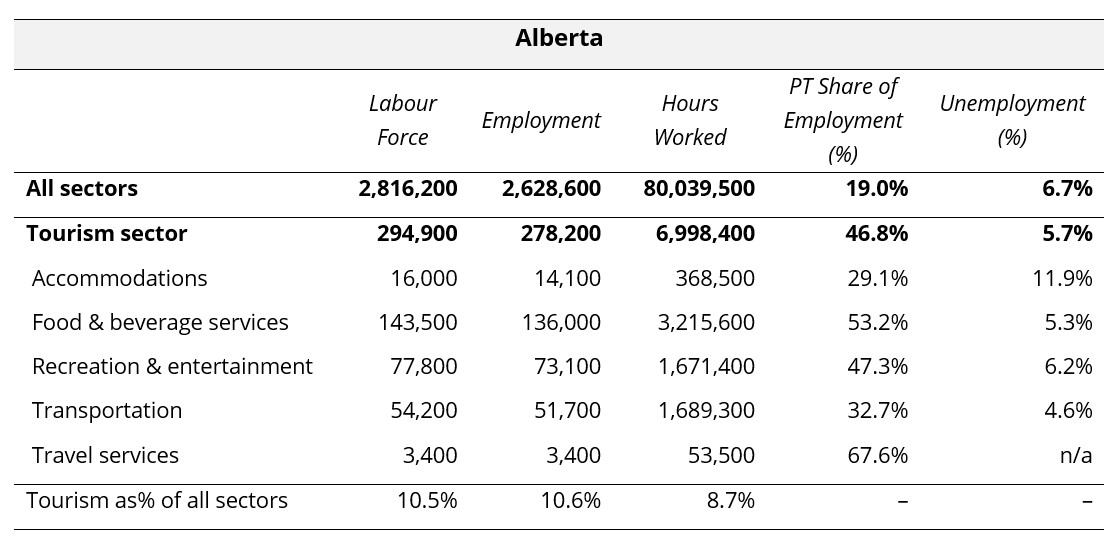
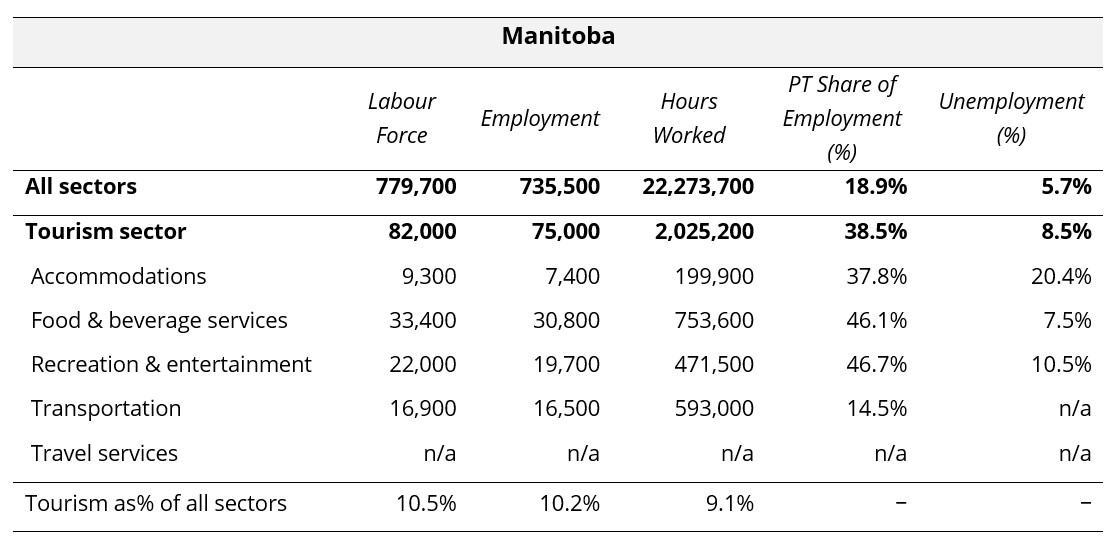
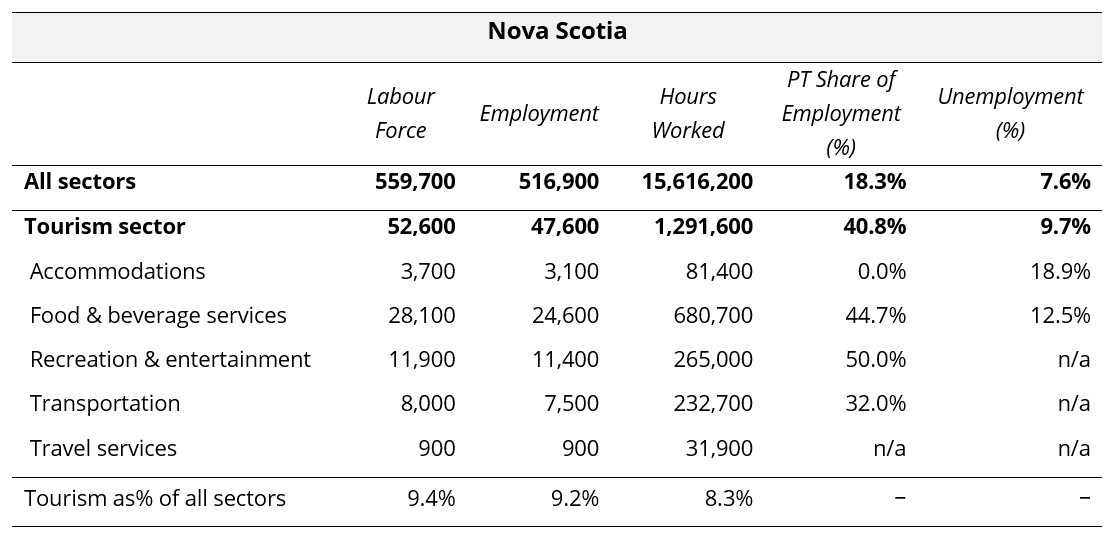
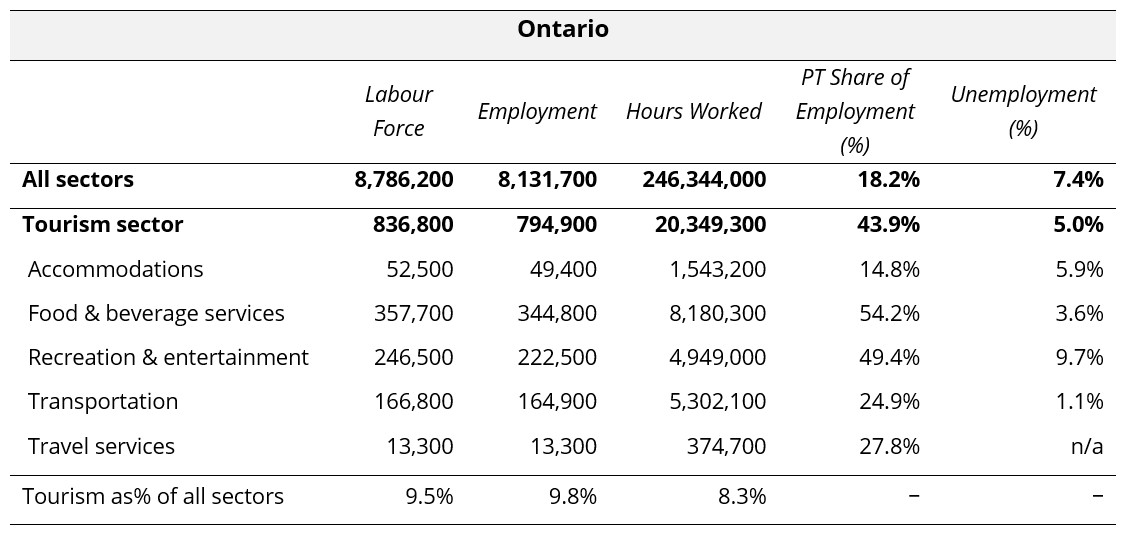
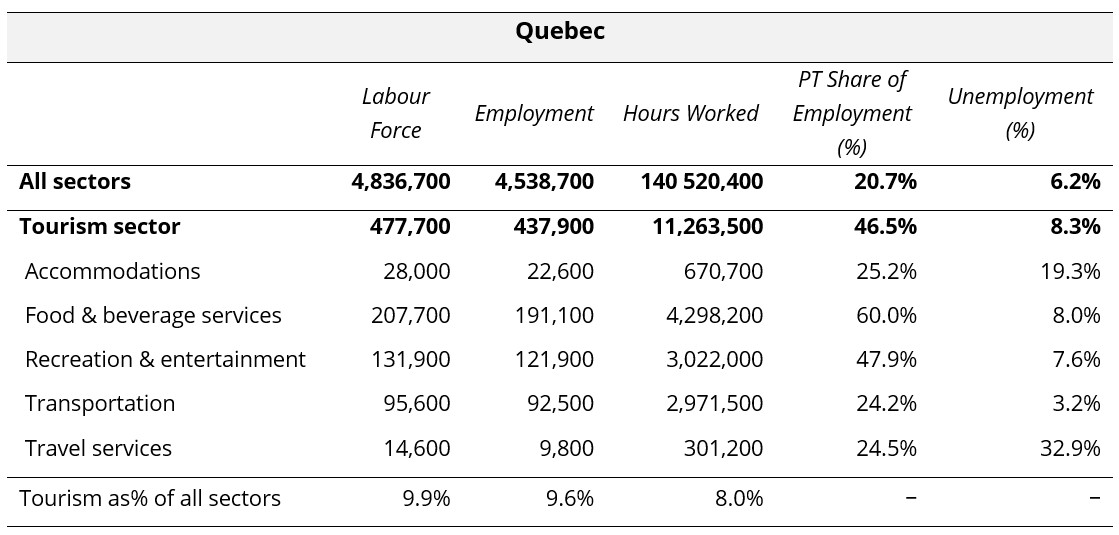
Provincial Summaries for February 2026
The following ten tables provide February 2026 summaries for the provinces, focusing on tourism and its five industry groups. Comparison data is provided for the larger provincial economy, as a benchmarking reference. Seasonally unadjusted estimates are provided for labour force, employment, and hours worked, and the final row of each table indicates tourism’s share of each of these metrics. The share of work that is part-time (as opposed to full-time) is also provided, as a rough indicator of the labour composition, as well as the unemployment rates.
Where data was not available due to suppression from Statistics Canada, “n/a” has been entered in the table. The three territories are not included in the LFS releases at this level of granularity, so no comparison is possible between the territories and the provinces. The provinces are listed alphabetically.


View more employment charts and analysis on our Tourism Employment Tracker.
[1] As defined by the Canadian Tourism Satellite Account. The NAICS industries included in the tourism sector those that would cease to exist or would operate at a significantly reduced level of activity as a direct result of an absence of tourism.
[2] SOURCE: Statistics Canada Labour Force Survey, customized tabulations. Based on seasonally unadjusted data collected for the period of February 15 to 21, 2026.
[3] Statistics Canada defines full-time work as 30 hours per week, and part-time work as less than 30 hours per week.