Pre-Holiday Travel Lull Leads to Slight Drop in Employment.
While December often marks a time of travel for many Canadians, the pre-holiday period—which the December Labour Force Survey targeted—remains a bit of a lull, with many businesses not yet ramping up their winter operations. To top it off this year, ongoing economic and political uncertainty marked the tail end of 2025 by muting tourism demand, particularly from U.S. markets[1], so it is perhaps unsurprising to note that the tourism sector[2] in December 2025 saw a small contraction from November, with both labour force and employment falling by around 1.3%[3].

At the industry group level, accommodations and transportation reported gains, countered by losses in food and beverage services and recreation and entertainment.
Table 1 provides a snapshot of each industry group’s performance across labour force, employment, and unemployment, as compared with November 2025 [MoM], December 2024 [YoY], and December 2019 as a pre-pandemic baseline. Small arrows represent changes of less than 1% (or one percentage point, in the case of unemployment).

The sector was in a stronger position overall than it was one year ago, with only food and beverage services seeing a decline—particularly in labour force—which lowered the unemployment rate for this industry group. Indicators across most industry groups were also positive with respect to pre-pandemic employment and labour force, with sector-level gains tempered by further losses in food and beverage services.
Tourism Sector
In December, tourism employment fell by around 28,000 people from November, in parallel with a comparable loss in labour force, holding the unemployment rate held steady at 4.9%. Labour force (+1.8%) and employment (+2.6%) were both higher than last year, and slightly above the pre-pandemic levels of 2019. Table 2 provides a summary of the sector-level labour statistics.

Across all sectors of the Canadian economy, the unemployment rate was 6.3% (see Table 3), edging up slightly from 6.1% in November (calculated using seasonally unadjusted data). Both labour force and employment saw a very slight contraction from November.

Tourism employment accounted for 10.0% of all employment in Canada in November, and around 9.4% of the total Canadian labour force worked in tourism.
Part-Time and Full-Time Employment
Part-time work[4] at the sector level was unchanged from November (Figure 1), and has held steady over the past few Decembers—and was the same as it was in December 2019. Month-over-month, food and beverage services, recreation and entertainment, and transportation generally held the ratio of part-time work steady, while accommodations and travel services saw increases in part-time work, although relative to 2019, accommodations has seen a general decrease in part-time work, while travel services has seen a sharp uptick. Recreation and entertainment has also increased its share of part-time work since 2019, while food and beverage services has stayed relatively steady at around 50%.

Hours Worked
Hours worked provides a useful perspective on the stability of the tourism workforce, as it allows us to triangulate across employment numbers and part-time work share. Total hours worked in tourism in December fell very slightly from November (Figure 2), but the relative loss (-0.3%) was smaller than the losses in employment (-1.3%) noted above. The general trend of year-over-year increase continued in December, although the total hours worked at the sector level did not surpass 2019 levels, as it did in November of this year.

At the industry group level (Figure 3), hours worked in accommodations saw a substantial increase from last year (+24.6%), as did transportation (7.9%) and, to a lesser extent, recreation and entertainment (2.3%). In contrast, food and beverage services saw a decrease of 4% over the past year, indicating that this industry group is struggling to maintain a consistent growth trajectory. As eating out is one of the discretionary expenditures that is most easily curtailed in economically uncertain times, this may reflect increasing financial pressures in the runup to the holidays.
Food and beverage services and travel services are the only two industries to have yet surpassed pre-pandemic levels. Data for travel services is not always reliable in the short term, but the fact that hours worked have consistently been around 50% below 2019 levels suggests a long-term scaling back in this industry.

Industry Closeup: Accommodations
Accommodations grew both its labour force and employment from November, and continued to show strong gains year-over-year. In fact, December 2025 marked the first time since the pandemic that employment and labour force numbers have surpassed 2019 levels. These increases in employment also account for the increase in hours worked noted above, suggesting that this industry group is starting to gain momentum. However, given the sampling methodologies of the Labour Force Survey itself, we should be cautious in reading too much into this early indicator until it develops into a longitudinal trend.

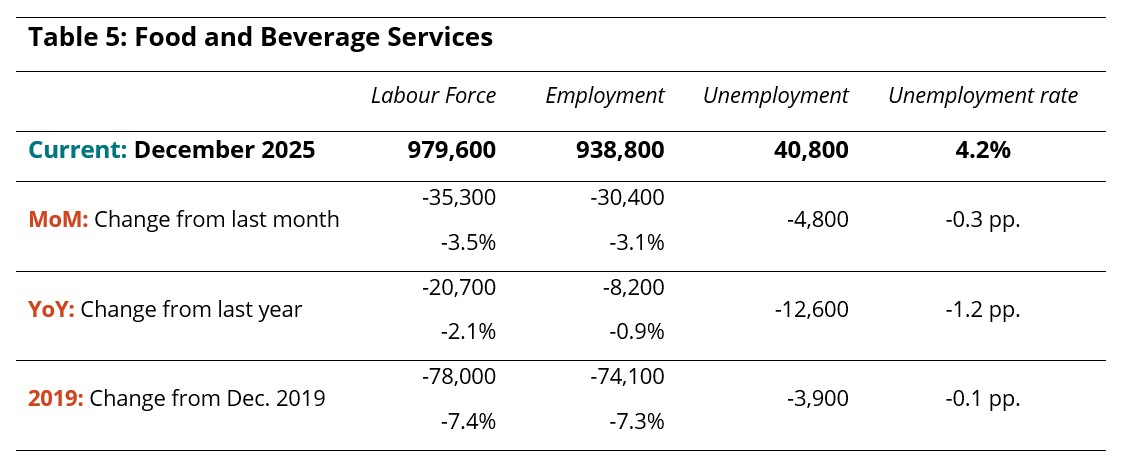
Industry Closeup: Food and Beverage Services
Labour force and employment both fell for food and beverage services in December, seeing around 30,000 people leave employment in the industry and bringing employment levels to their lowest since March of this year. Both indices were lower than last year as well, and the industry remained around 7% below 2019 levels. However, labour force decreases have outpaced employment decreases, which effectively lowered the unemployment rate to 4.2%, the lowest it has been all year.
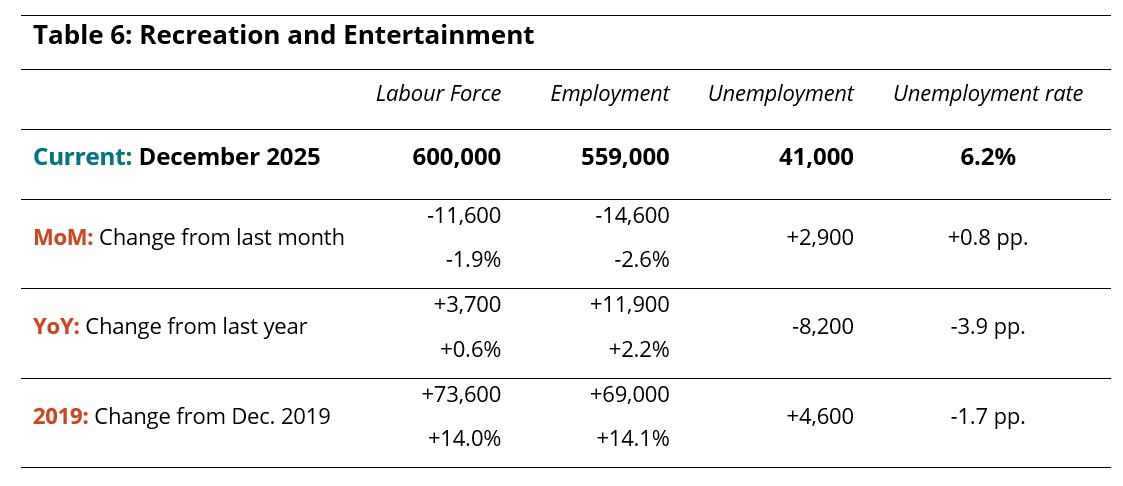
Industry Closeup: Recreation and Entertainment
Recreation and entertainment, which has shown fairly consistent growth throughout the past year, saw decreases in both labour force and employment in December, pulling the unemployment rate up to 6.8%. However, the industry remained in a slightly stronger position than it was last year, and in a substantially stronger one with respect to 2019, with a workforce of around 70,000 more people.
Industry Closeup: Transportation
Transportation saw very little movement from November, with the unemployment rate remaining stable at 2.6% and decreases of only 0.1% in both labour force and employment. Relative to last year and to 2019, the industry was in a much stronger position, continuing the trend observed over the past year.

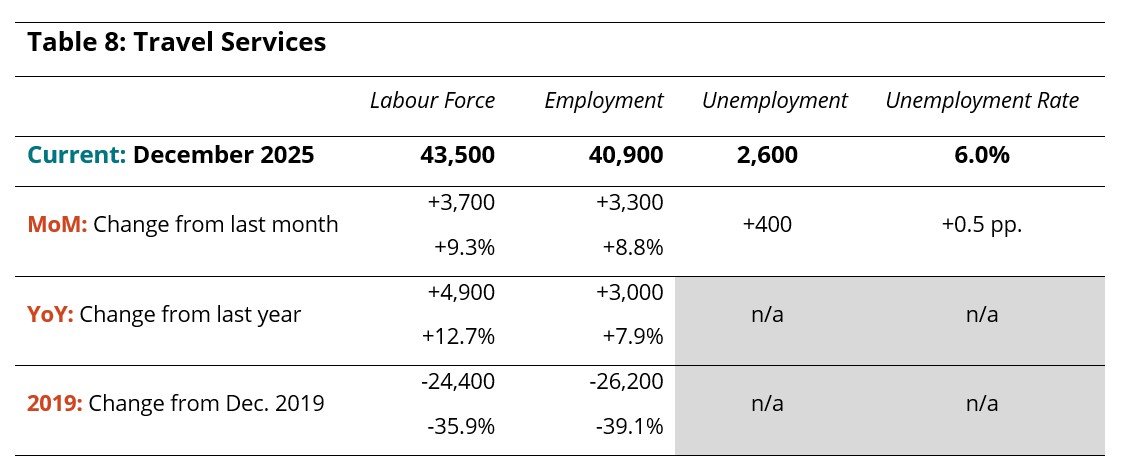
Industry Closeup: Travel Services
The data in the Labour Force Survey relating to travel services is not always entirely reliable, as its small size relative to the tourism sector—to say nothing of the entire economy—means that small changes in the sample may become exaggerated when scaled up to the population. While month-to-month fluctuations in the data may be misleading, general trends can nevertheless indicate shifts in the industry.
In December there were moderate increases in both labour force and employment levels in the survey, although these increases were not large enough to correct for the losses incurred over the course of the pandemic; the travel services workforce remained around 1/3 of its 2019 size.
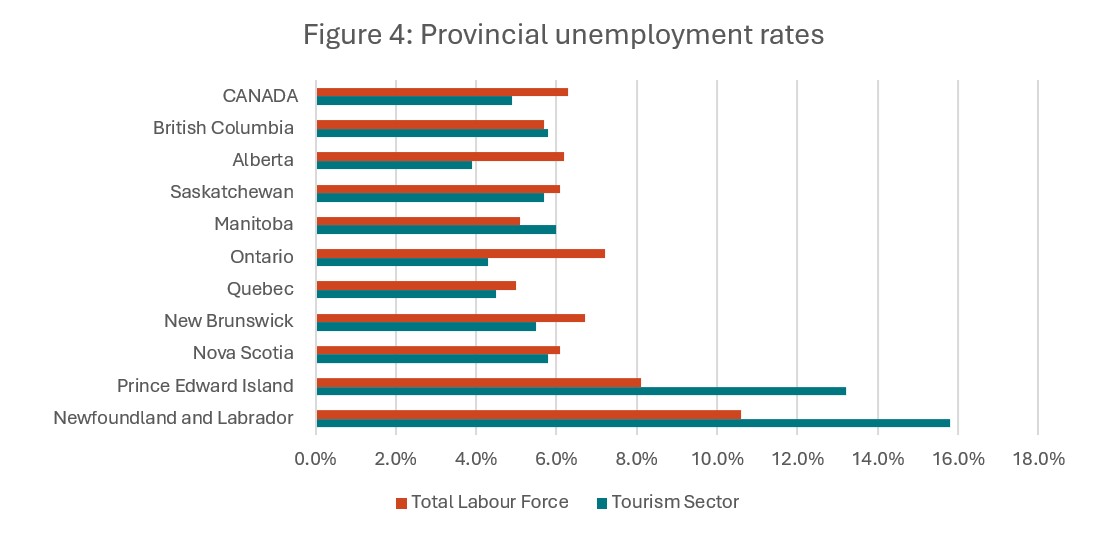
Provincial Perspectives
The Canadian economy is subject to some pronounced regional differences, and that is particularly true in the tourism sector. Figure 4 provides a comparison of provincial unemployment rates, for the tourism sector in particular and for the total labour force (i.e., comprising all industries). Tourism unemployment rates remained below provincial averages in all but four provinces (British Columbia, Manitoba, Prince Edward Island, and Newfoundland and Labrador). Tourism unemployment rates were highest in Newfoundland and Labrador (15.8%) and Prince Edward Island (13.2%), which is not uncommon in winter; and rates were lowest in Alberta (3.9%) and Ontario (4.3%).
Provincial Summaries for December 2025
The following ten tables provide December 2025 summaries for the provinces, focusing on tourism and its five industry groups. Comparison data is provided for the larger provincial economy, as a benchmarking reference. Seasonally unadjusted estimates are provided for labour force, employment, and hours worked, and the final row of each table indicates tourism’s share of each of these metrics. The share of work that is part-time (as opposed to full-time) is also provided, as a rough indicator of the labour composition, as well as the unemployment rates.
Where data was not available due to suppression from Statistics Canada, “n/a” has been entered in the table. The three territories are not included in the LFS releases at this level of granularity, so no comparison is possible between the territories and the provinces. The provinces are listed alphabetically.


View more employment charts and analysis on our Tourism Employment Tracker.
[1] SOURCE: Statistics Canada, Leading indicator of international arrivals to Canada, December 2025.
[2] As defined by the Canadian Tourism Satellite Account. The NAICS industries included in the tourism sector those that would cease to exist or would operate at a significantly reduced level of activity as a direct result of an absence of tourism.
[3] SOURCE: Statistics Canada Labour Force Survey, customized tabulations. Based on seasonally unadjusted data collected for the period of December 7 to 13, 2025.
[4] Statistics Canada defines full-time work as 30 hours per week, and part-time work as less than 30 hours per week.