August is typically a busy month for tourism: it’s the end of summer, and many families take the opportunity for one last break before school and work return to normal in September. This year, of course, the season has been overshadowed by tariffs, economic pressures, and global uncertainties, the effects of which have been building for months and are starting to be felt across the sector.
While travel indicators suggest that Canadians are travelling less to the United States, and spending more time in Canada or in other countries, the economic data about tourism spending for the summer is not yet available, so the financial impact is not yet known. This report focuses exclusively on the labour market for the tourism sector, which is also affected by external social, political, and economic factors.
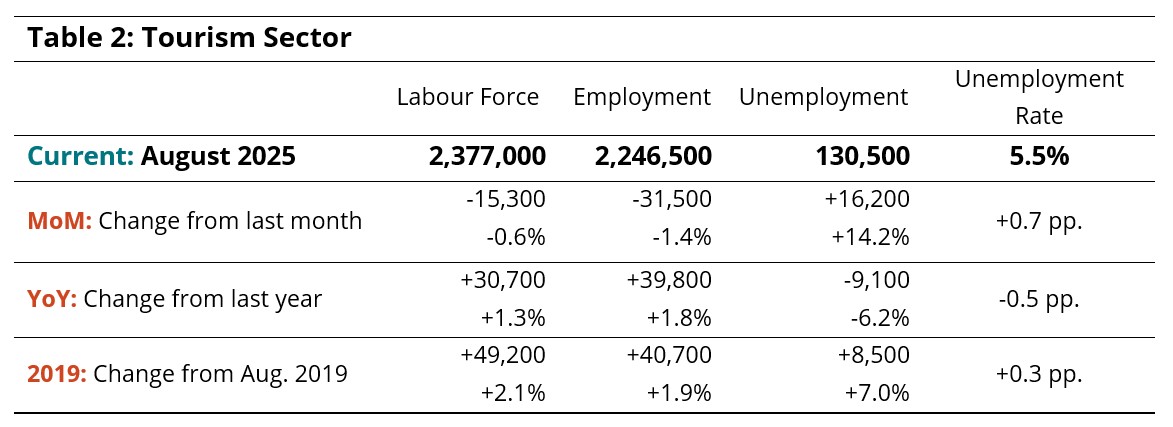
The tourism sector[1] in August 2025 saw some contraction from July, with small losses in both labour force (-0.6%) and employment (-1.4%) and a slight increase in the unemployment rate (+0.7 percentage points). There were some differences between the industry groups, with some showing stronger performance than others.
Table 1 provides a snapshot of each industry group’s performance across labour force, employment, and unemployment, as compared with July 2025 [MoM], August 2024 [YoY], and August 2019 as a pre-pandemic baseline. Small arrows represent changes of less than 1% (or one percentage point, in the case of unemployment).
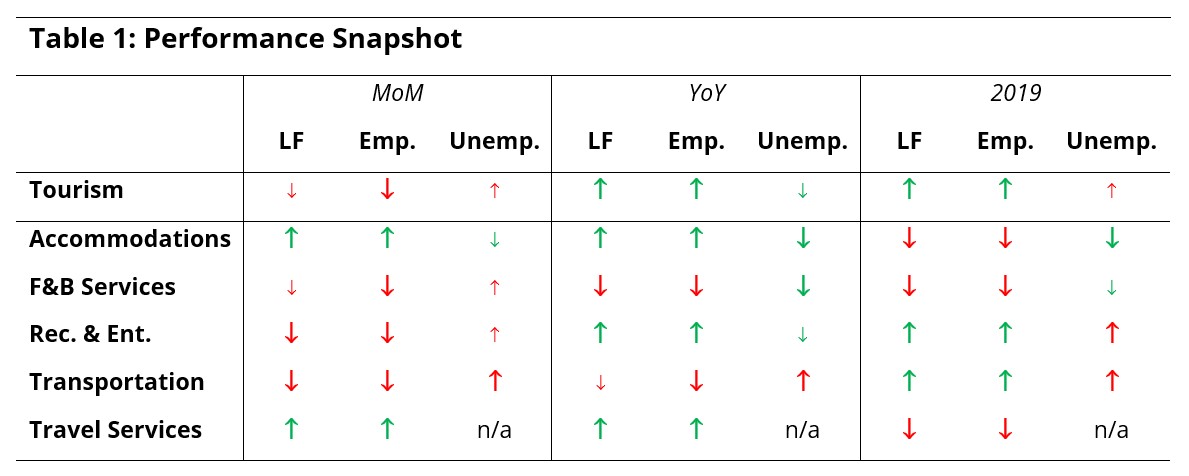
The losses from July to August were somewhat moderated by a strong performance in accommodations, which is an encouraging continuation of last month’s trend. In contrast, transportation showed a poorer performance relative to last month and to last year, although it remained in a stronger position than in 2019. The year-over-year snapshot was more positive than the month-over-month one, although food and beverage services showed some difficulties. The sector aggregate gains from 2019 were driven by strong conditions in recreation and entertainment and transportation.
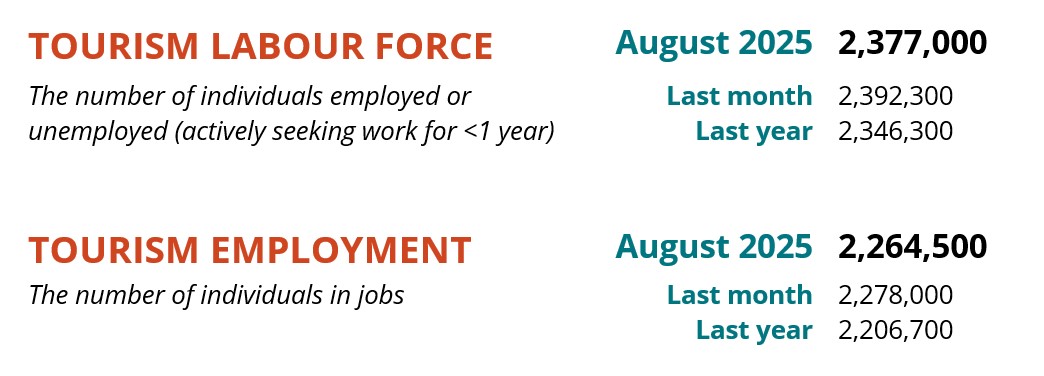
Tourism Sector
Around 15,000 people left the tourism labour force in August (Table 2), while employment fell by around 31,000. The net result of these losses was that the unemployment rate gained 0.7 percentage points to settle at 5.5%, representing around 130,000 people looking for work. Against a deeper time span (comparing to last year and to 2019), aggregate labour force and employment numbers in August showed slow but steady gains.
While the tourism sector has doubtless been feeling the effects of the economic stall, it looks to have been less severely impacted than other sectors (Table 3). Employment nudged downwards across the total economy while labour force grew, which edged the national economy-wide employment rate up to 8% from 7.2% in July (calculated using seasonally unadjusted data). The effects on tourism are likely to lag behind other sectors, but we can expect that layoffs and business closures elsewhere in the economy will eventually drive down domestic tourism demand.
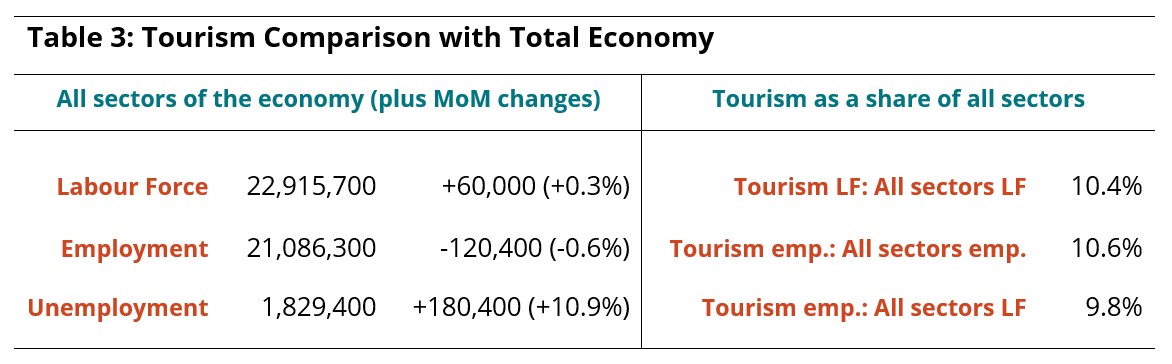
Tourism’s shares of overall labour force and employment were slightly lower in August than they were in July (-0.1 percentage points in both cases). Around 9.8% of the Canadian force was employed in a tourism business, down from 10% in July.
Part-Time and Full-Time Employment
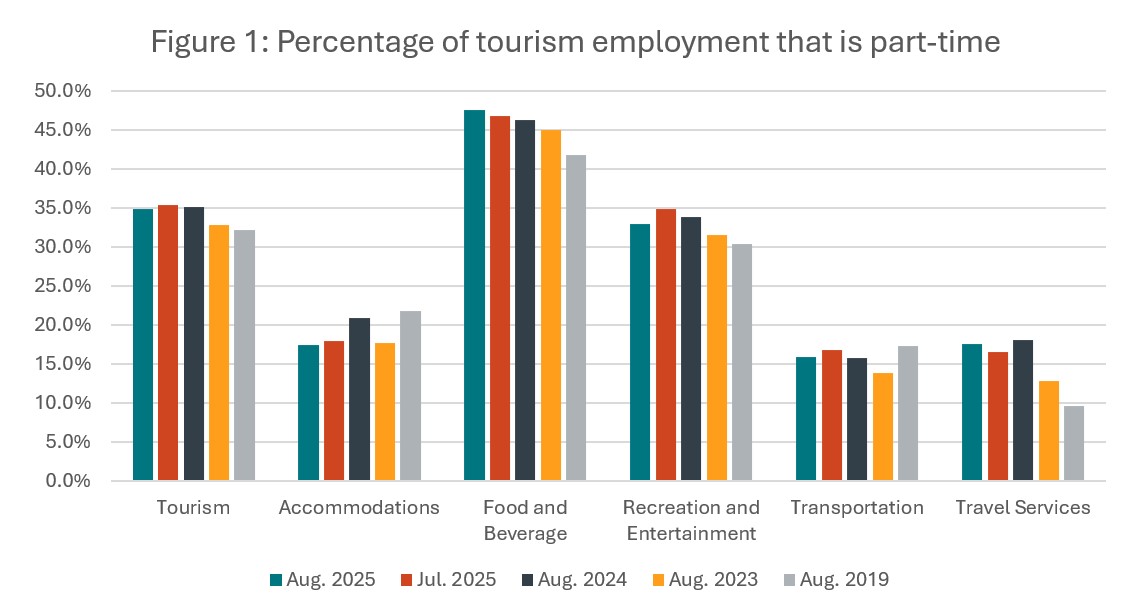
The ratio of part-time to full-time work provides an interesting perspective on the long-term stability of the tourism workforce[2]. From July to August, the overall sector ratio stayed at around 35% (Figure 1), with only minor changes across the industries. Most industry groups saw a slight increase in the share of full-time work, which is unsurprising given the shifts in employment numbers and those in hours worked (see Figure 2, below). Food and beverage services continued a general trend towards more reliance on part-time workers, even as employment levels fell from July.
Hours Worked
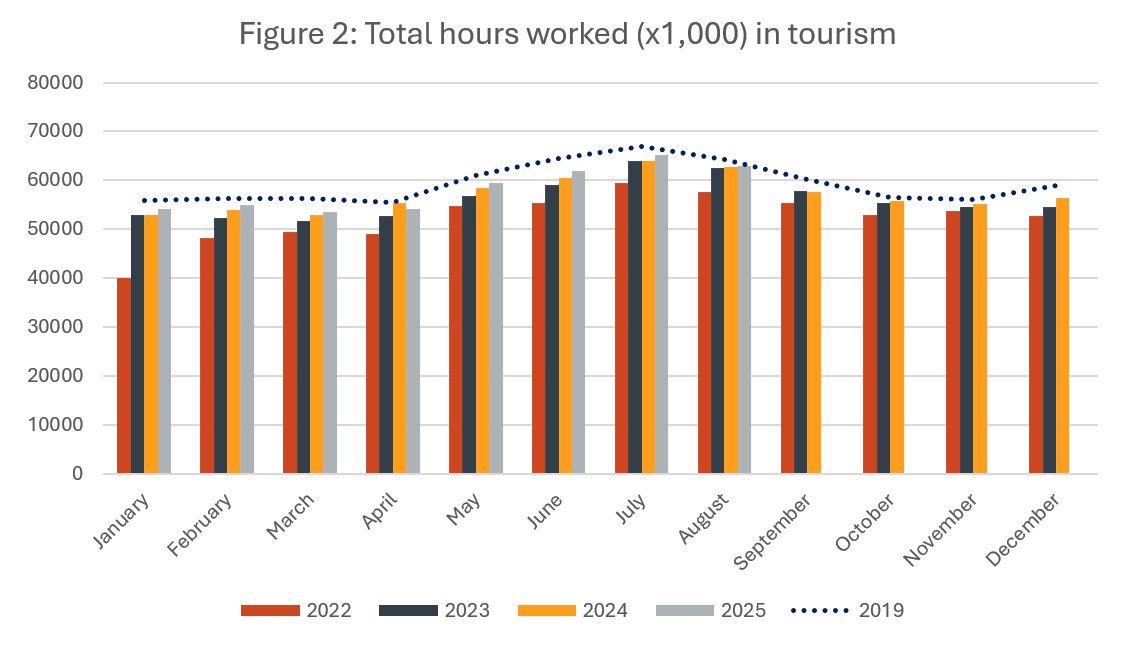
The number of hours worked is another useful metric for gauging the short-term stability of the workforce, as operators can scale hours worked more rapidly than they can hire or fire employees in response to fluctuations in customer demand. Total hours worked in August (Figure 2) fell slightly from July (-3.5%) but have remained fairly steady over the past three years. The gap with 2019 levels narrowed to 2.2 percentage points.
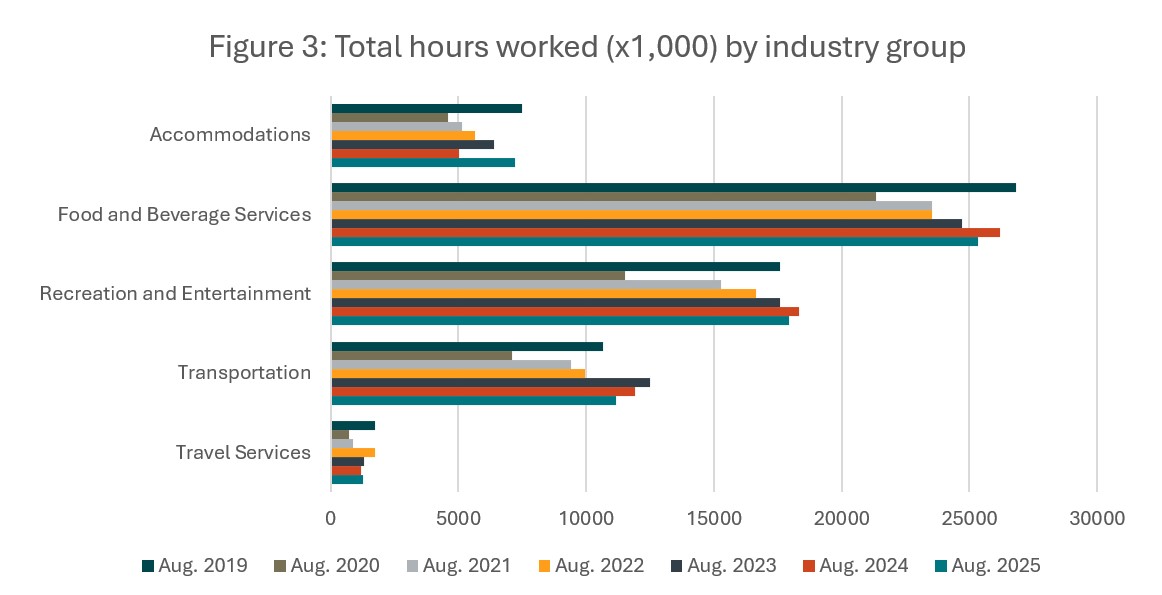
Accommodations saw a substantial increase in hours worked in the past year (Figure 3), with a gain that aligns with previous years’ trends, suggesting that 2024 was an anomalous year for this industry group. Year-over-year, total hours worked fell for food and beverage services, recreation and entertainment, and transportation. Hours worked in transportation have been declining since a peak in 2023, although remained above 2019 levels. There was a slight increase reported for travel services, although the small size of this industry group relative to the Labour Force Survey may make this data unreliable.
Industry Closeup: Accommodations
Accommodations added around 16,000 people to employment in August from July (+8.3%), continuing the trend of last month. There were also substantial gains over last year (in the neighbourhood of +30%), although as noted above, it’s likely that 2024 was an anomalous year in this industry group. The unemployment rate edged down to 4.1%. Both labour force and unemployment remained around 20,000 below where they were in 2019.

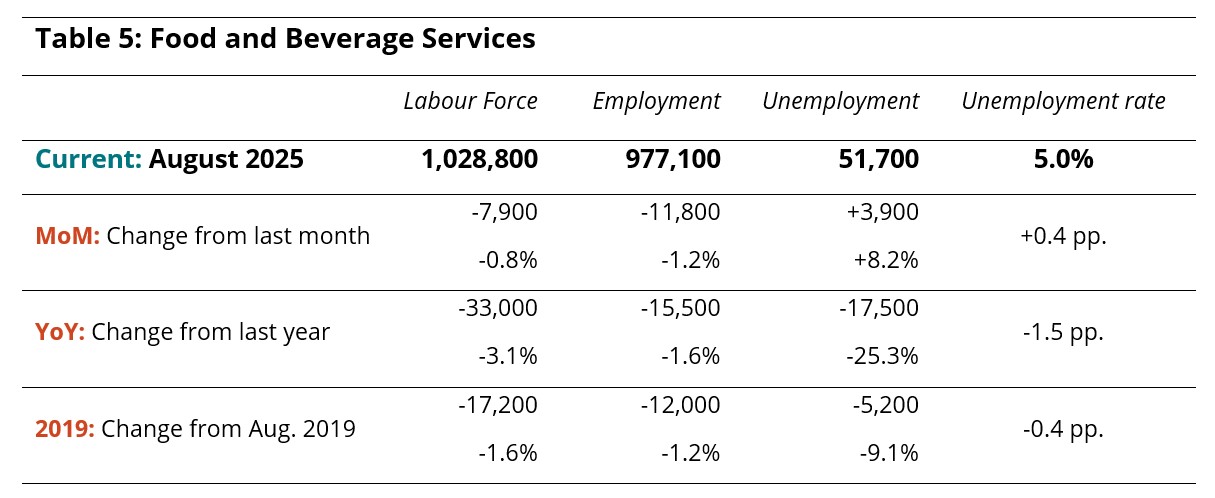
Industry Closeup: Food and Beverage Services
Food and beverage services saw slight declines in both labour force and employment from July, with nearly 12,000 fewer people working. The unemployment rate nudged up to 5.0%. The industry was also depressed relative to last August, and remained below 2019 levels. This industry group may be particularly susceptible to the early effects of economic disruption, as it relies to a large extent on local spending, and consumers may be foregoing smaller expenditures, such as dinner out, in favour of larger ones, such as a planned trip. It will be interesting to monitor this group as economic conditions continue to adjust to global and political realignments.
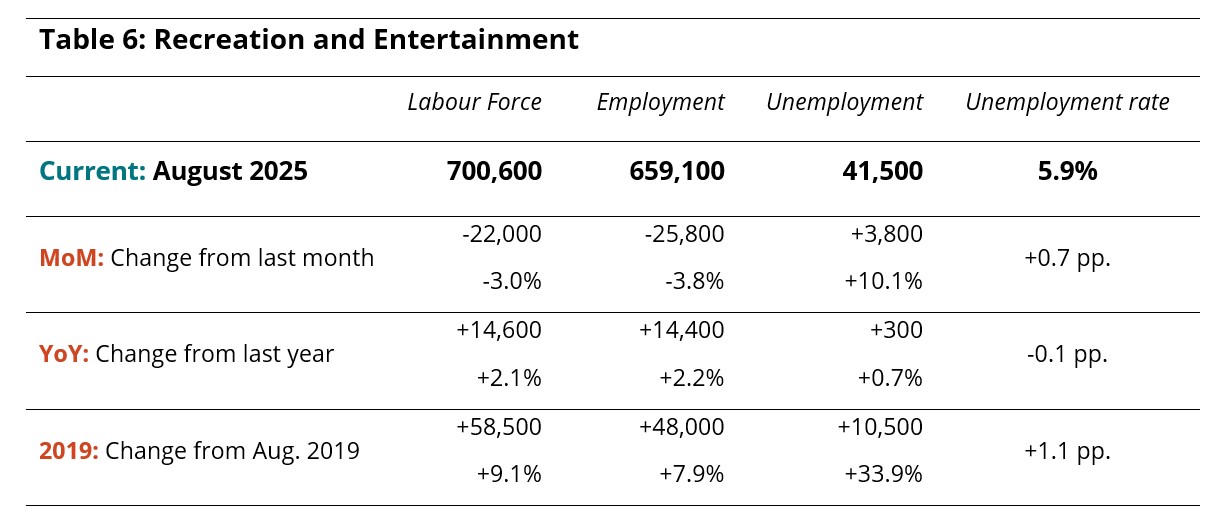
Industry Closeup: Recreation and Entertainment
For the first time in several months, recreation and entertainment lost ground in both labour force and employment in August, with nearly 26,000 people leaving employment (-3.8%). The unemployment rate rose to 5.9%, with nearly 4,000 people finding themselves newly out of work. The industry remained in a stronger position than it was in 2024, and continued to outpace its pre-pandemic levels on both major indices.
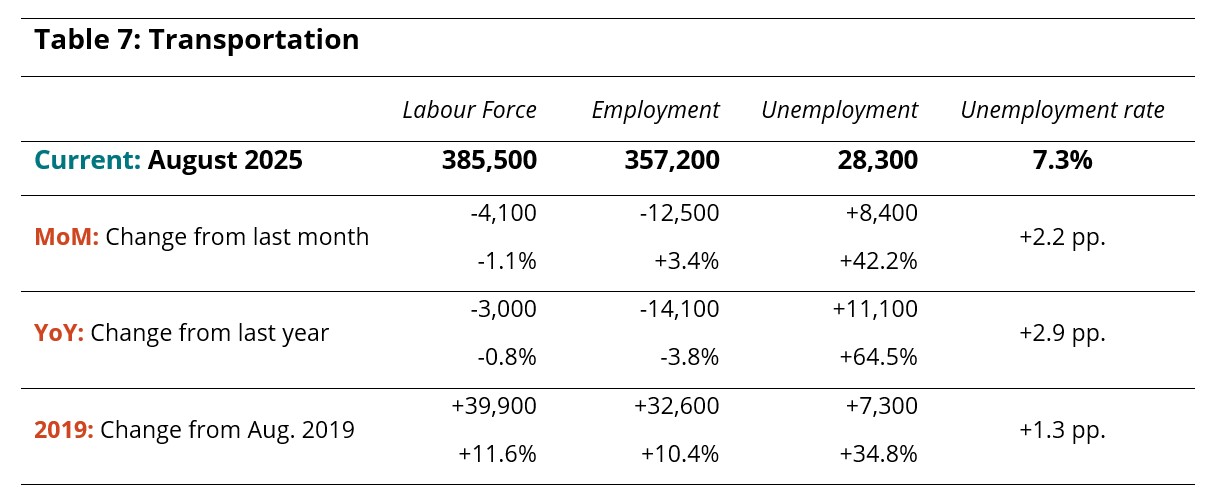
Industry Closeup: Transportation
Like recreation and entertainment, transportation has recently been showing consistent labour gains, and it also saw a decline from July, as well as a drop relative to last year. It has remained in a stronger position than it was in 2019, however. The unemployment rate in August reached 7.3%, which is unusually high for this industry group.
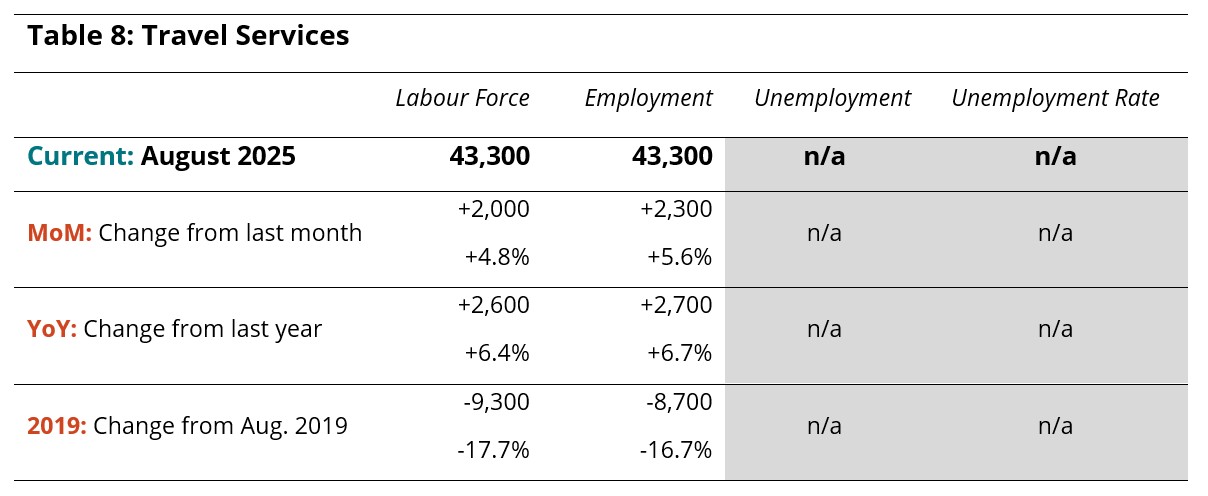
Industry Closeup: Travel Services
Travel services represents a small part of the tourism sector, which itself represents around 10% of the total labour force in Canada; as a consequence, this industry group is not particularly well-represented in the Labour Force Survey data. It is prone to disproportionately large swings from month to month, so monthly data should be interpreted cautiously. Its size also affects data suppression, meaning that unemployment data is rarely available.
The data for August 2025 suggests moderate gains from July and relative to last year, but the sector remains around 17% below where it was before the pandemic.
Provincial Perspectives
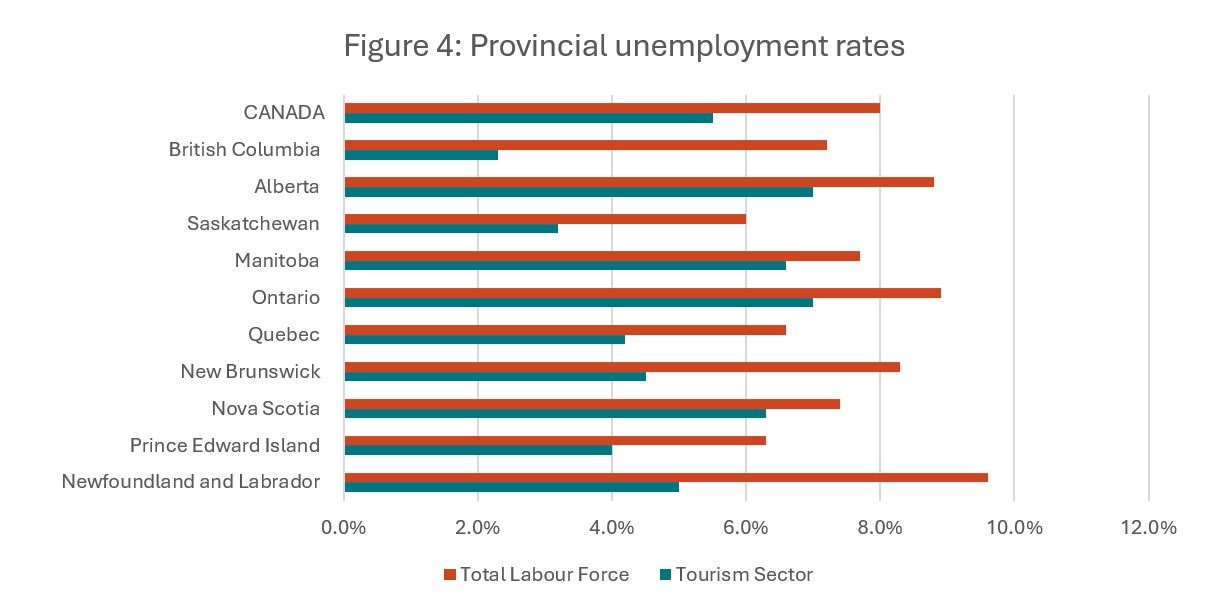
The Canadian economy is subject to some pronounced regional differences, and that is particularly true in the tourism sector. Figure 4 provides a comparison of provincial unemployment rates for the tourism sector in particular and for the total labour force (i.e., comprising all industries).
Across all provinces, the tourism unemployment rate remained below that of the broader provincial economy, sometimes substantially so. The difference was largest in British Columbia (4.9 percentage points) and in Newfoundland and Labrador (4.6 percentage points), and narrowest in Nova Scotia and Saskatchewan (1.1 percentage points for each). Tourism unemployment rates were lowest in British Columbia (2.3%) and Saskatchewan (3.2%), and highest in Ontario and Alberta (7.0% in each province).
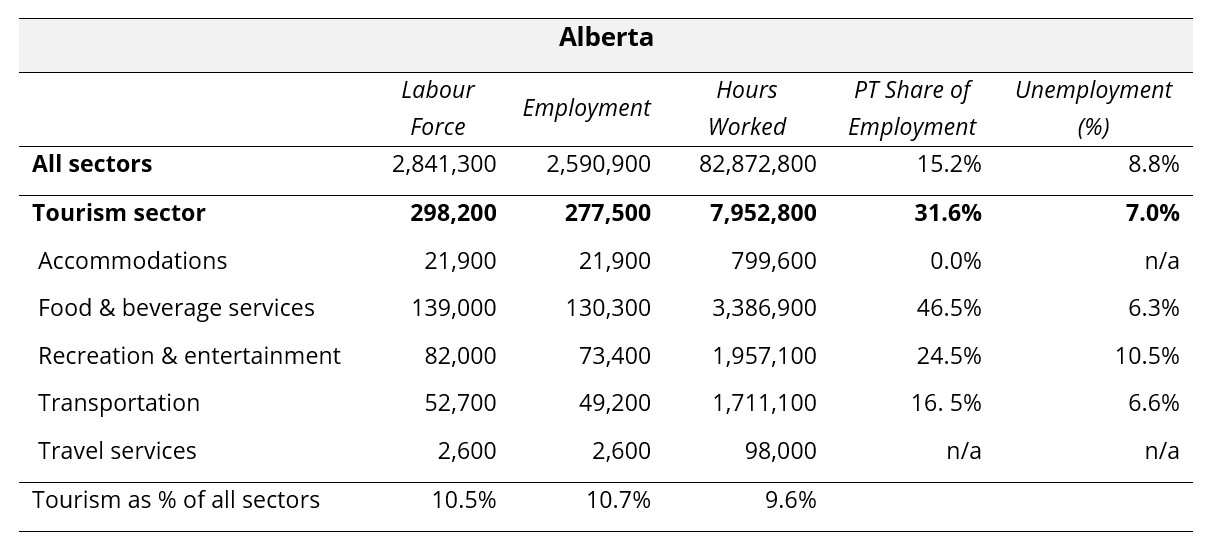
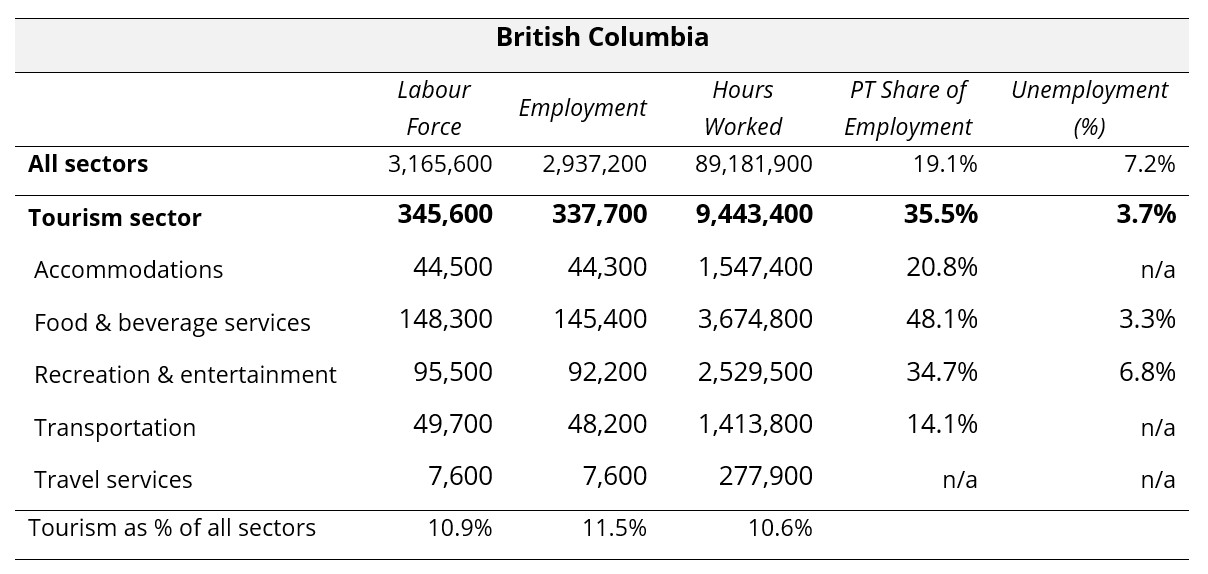
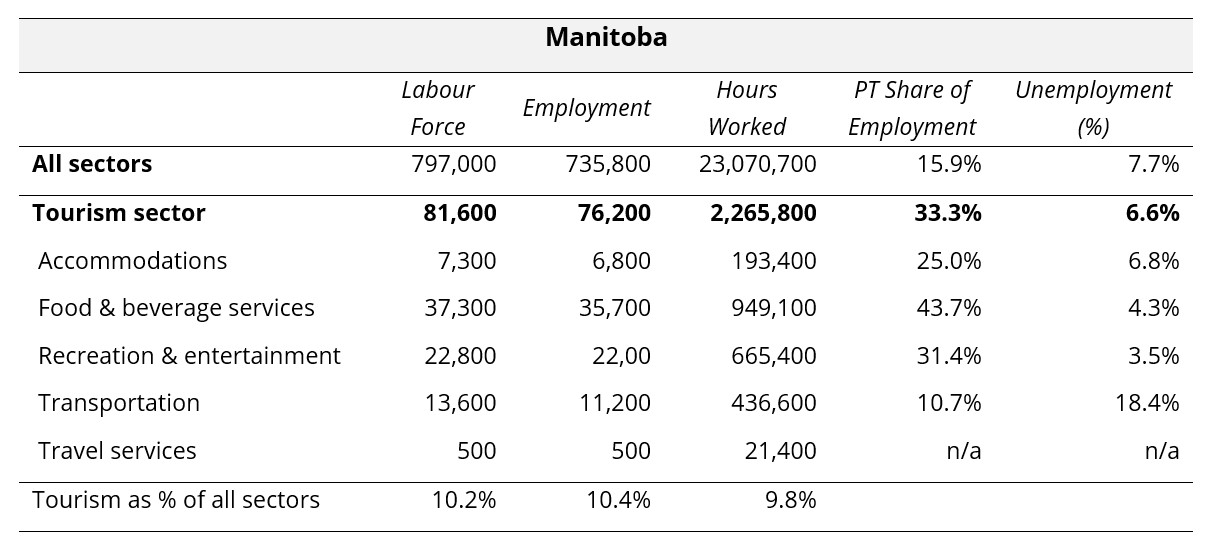
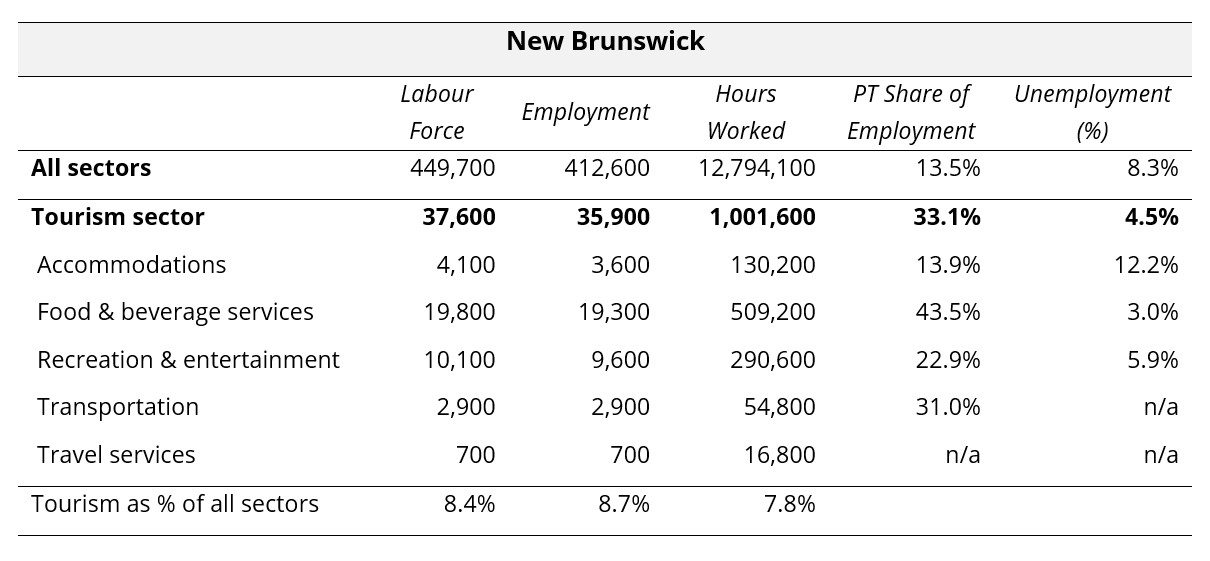
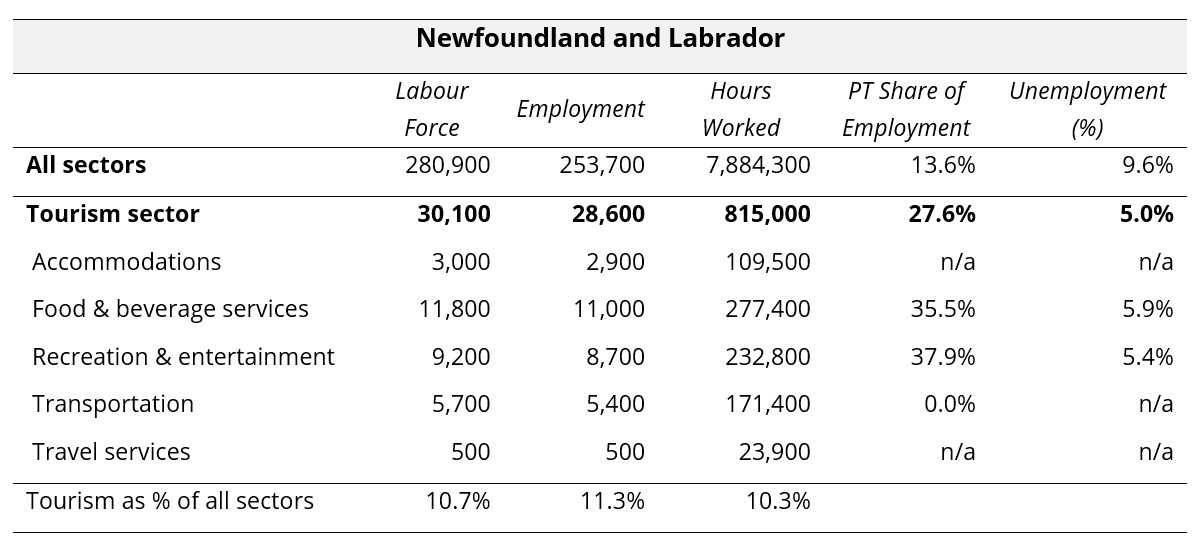
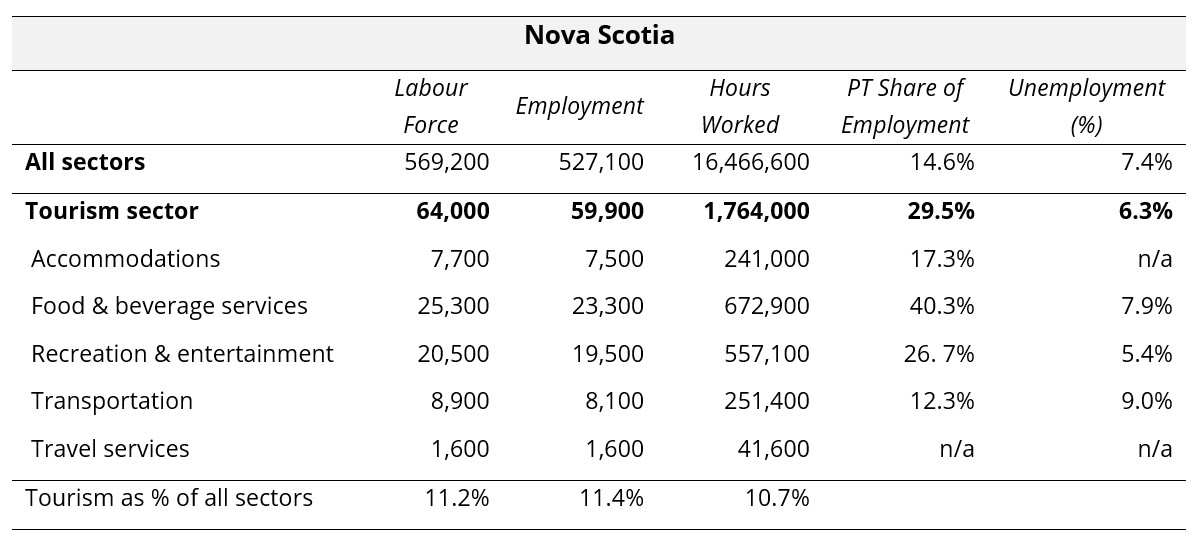
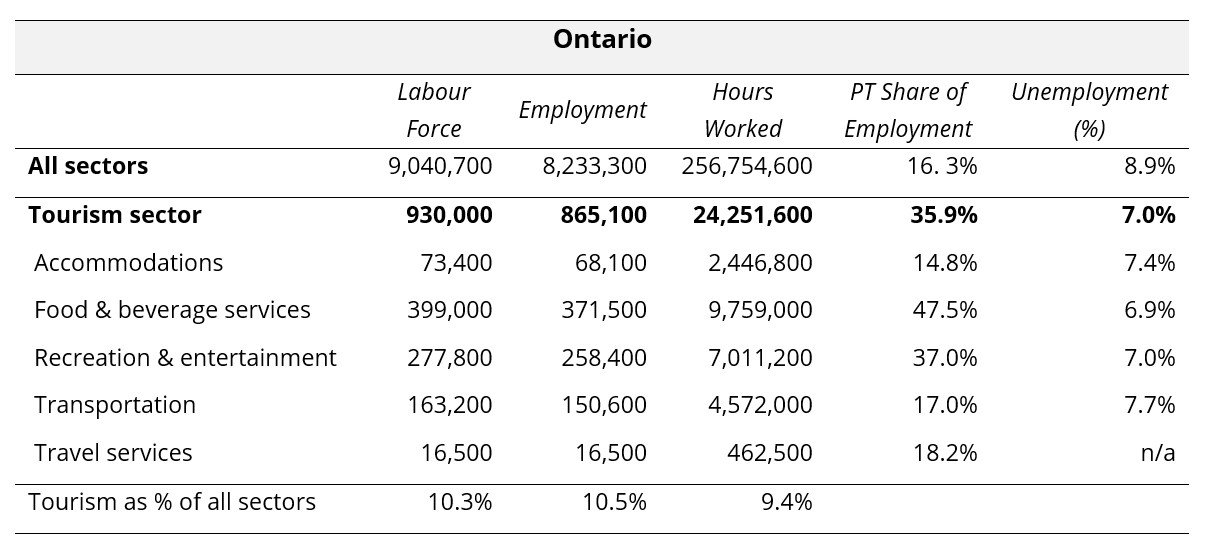
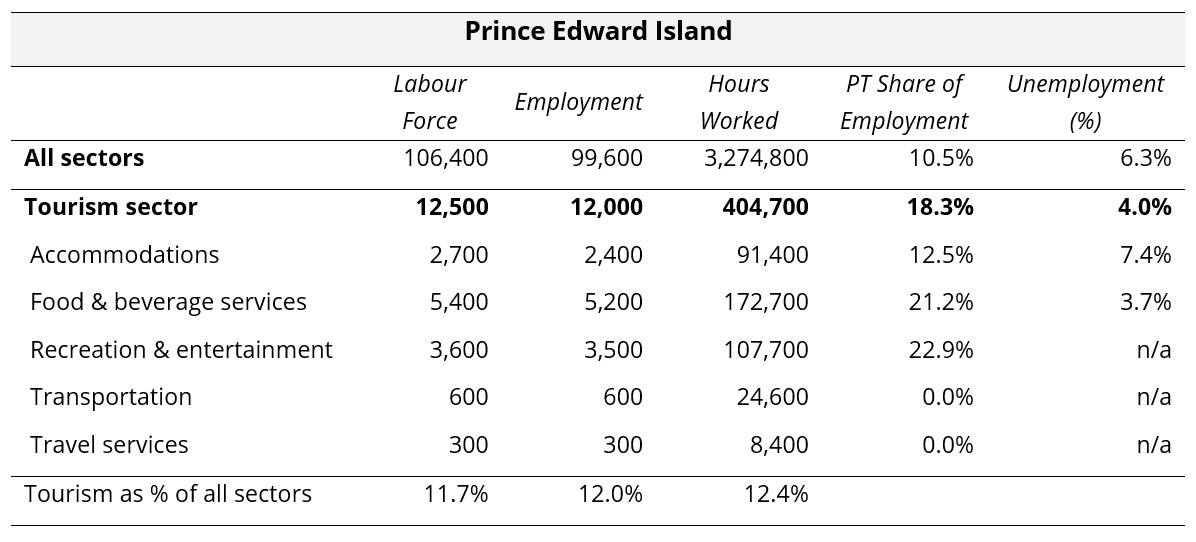
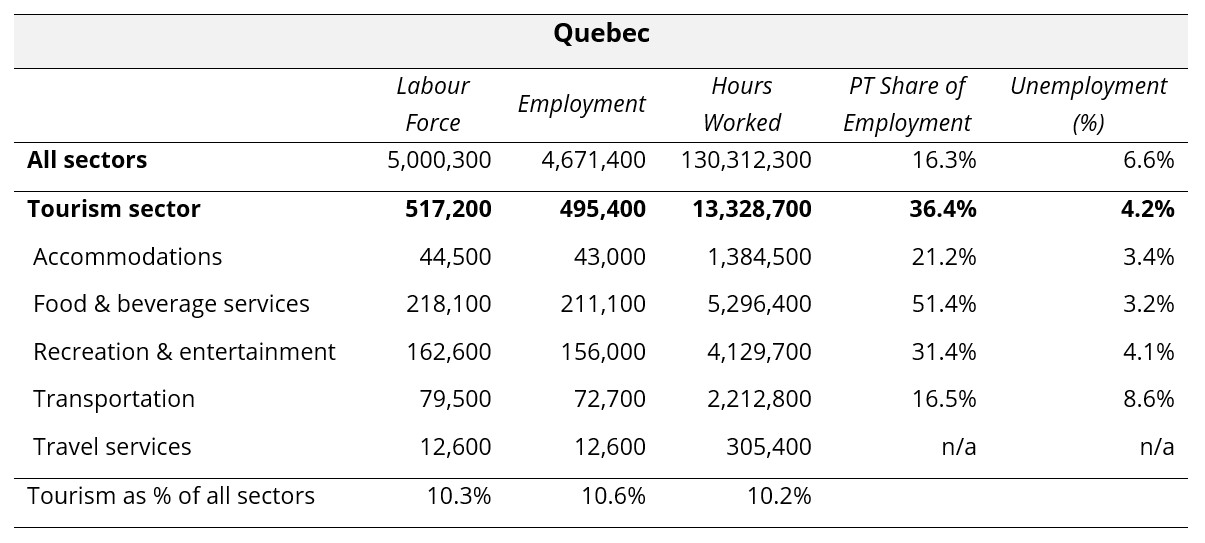
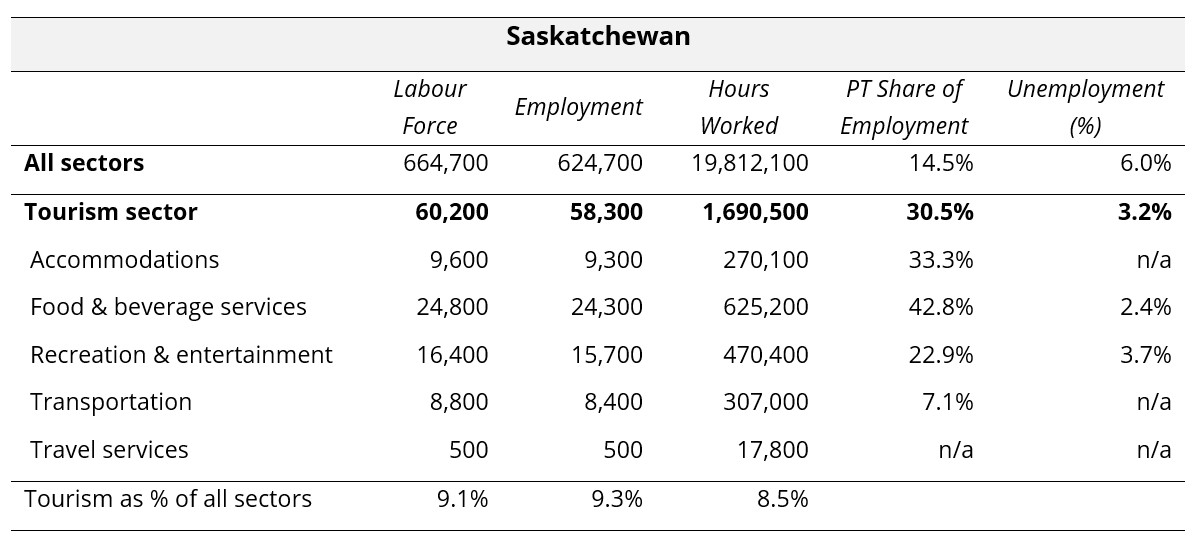
Provincial Summaries for August 2025
The following ten tables provide August 2025 summaries for the provinces, focusing on tourism and its five industry groups. Comparison data is provided for the larger provincial economy, as a benchmarking reference. Seasonally unadjusted estimates are provided for labour force, employment, and hours worked, and the final row of each table indicates tourism’s share of each of these metrics. The share of work that is part-time (as opposed to full-time) is also provided, as a rough indicator of the labour force composition, as are unemployment rates.
Where data was not available due to suppression from Statistics Canada, “n/a” has been entered in the table. The three territories are not included in the LFS releases at this level of granularity, so no comparison is possible between the territories and the provinces. The provinces are listed alphabetically.
View more employment charts and analysis on our Tourism Employment Tracker.
[1] As defined by the Canadian Tourism Satellite Account. The NAICS industries included in the tourism sector those that would cease to exist or would operate at a significantly reduced level of activity as a direct result of an absence of tourism.
[2] The Statistics Canada threshold for full-time work is 30 hours per week.