Momentum Continues to Build in Tourism Employment.
In spite of economic headwinds in the face of trade uncertainty, domestic tourism demand stayed strong into June, allowing the tourism labour market to maintain its momentum from May. Both labour force and employment in the tourism sector[1] grew from May, while unemployment fell slightly[2]. These patterns mirror the year-over-year changes with respect to June 2024, and to a lesser extent with respect to June 2019.
| Tourism Labour Force | June 2025 | 2,317,900 |
| The number of individuals employed or unemployed (actively seeking work for <1 year) | Last month | 2,272,200 |
| Last year | 2,286,700 |
| Tourism Employment | June 2025 | 2,197,400 |
| The number of individuals in jobs | Last month | 2,138,200 |
| Last year | 2,145,100 |
At the industry group level, most industries saw gains over May, with more variability over longer time periods. Although the sector overall has surpassed pre-pandemic levels, this aggregate masks substantial industry-level differences.
Table 1 provides a snapshot of each industry group’s performance across labour force, employment, and unemployment, as compared with May 2025 [MoM], June 2024 [YoY], and with June 2019 as a pre-pandemic baseline. Small arrows represent changes of less than 1% (or one percentage point, in the case of unemployment).
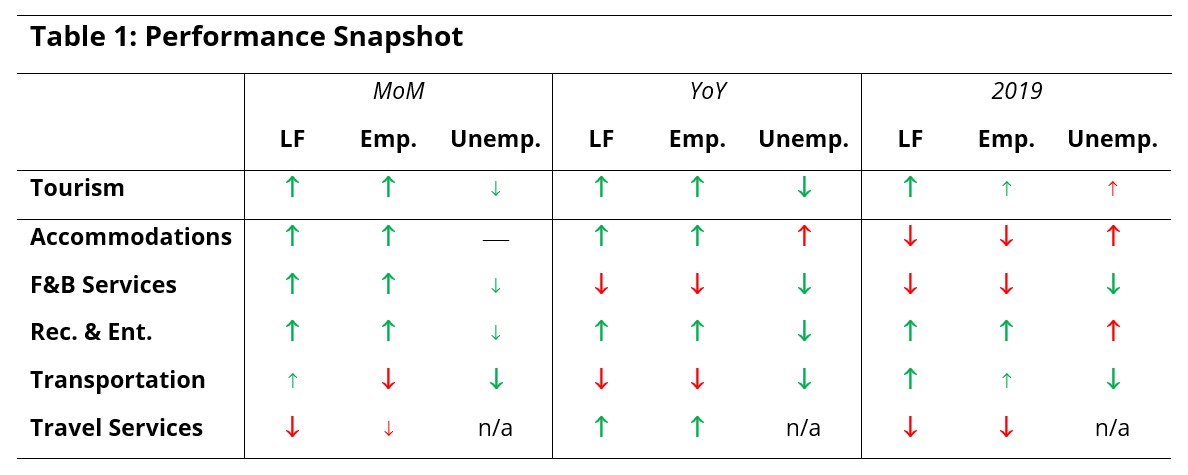
The sector generally saw gains from May, which aligns with seasonal trends observed in the past. Most industry groups were in a stronger position than they were this time last year, although food and beverage services and transportation had both lost ground on labour force and employment numbers. The net gains across the sector since 2019 have been entirely the result of very strong performance in recreation and entertainment and in transportation, where growth has offset losses in other industries.
Travel services remains a bit of a wildcard in the Labour Force Survey (LFS) data, due to its small size relative to the tourism sector overall, and to how the LFS samples the population. This report includes reported figures for this industry group, but readers should be cautious in interpreting substantial changes over the short term.
Tourism Sector
The sector saw 45,000 people join the labour force (+2%) and almost 60,000 people found employment (+3%), bringing the total employment to just shy of 2.2 million people (Table 2). On both labour force and employment, tourism had surpassed 2024 and 2019 levels.
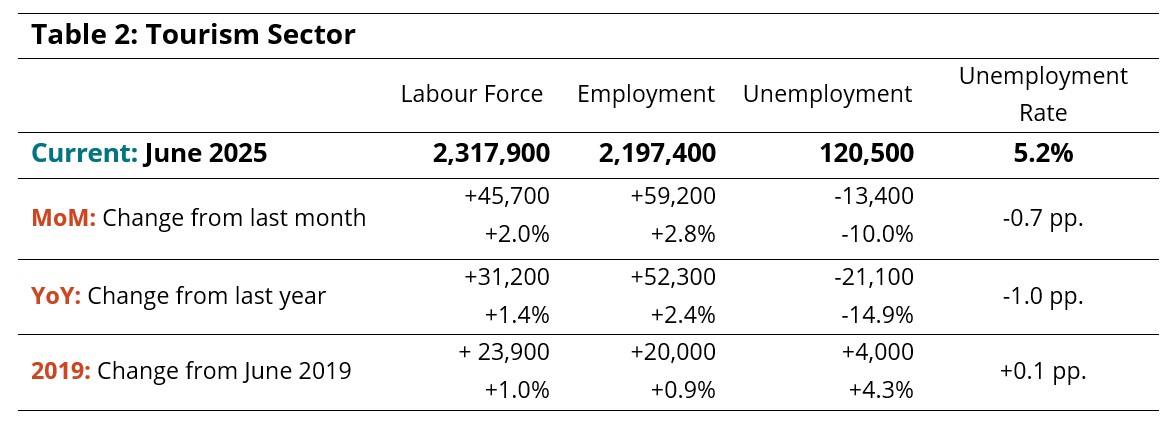
The tourism unemployment rate was 5.2%, around 1.3 percentage points below the economy-wide national average (6.5%, calculated using seasonally unadjusted data).
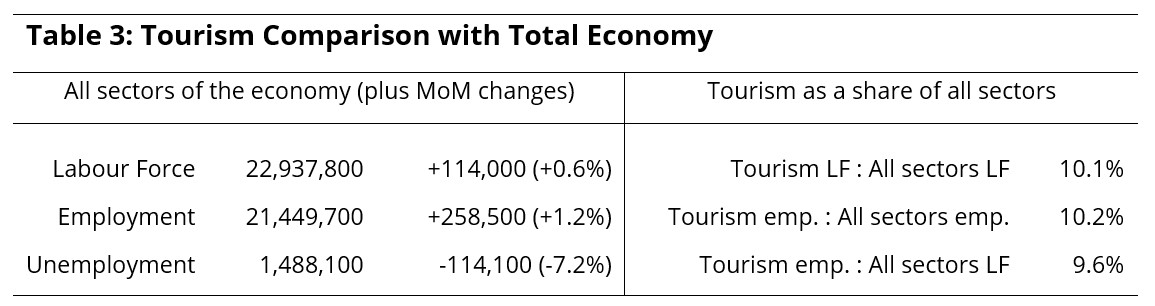
The tourism sector in June accounted for around 10% of the Canadian labour force and 10% of employment (Table 3), with 9.6% of the overall Canadian labour force employed in a tourism industry.
Part-Time and Full-Time Employment
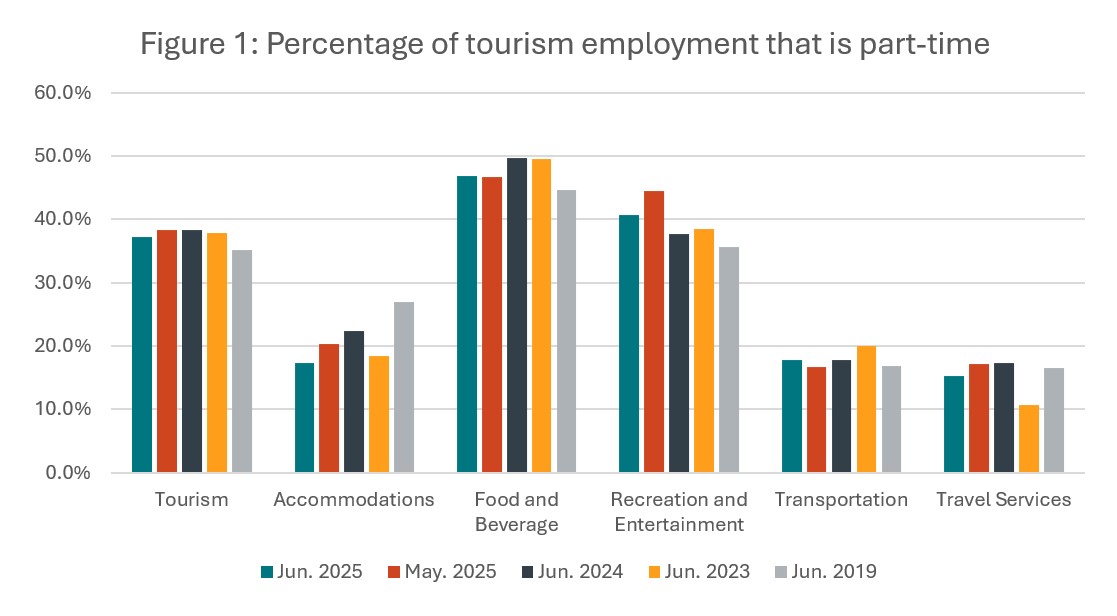
The share of part-time employment in tourism provides a useful perspective on the stability of the tourism workforce. From May to June this year, there was an overall slight decrease in part-time work (Figure 1), likely representing a shift from part-time to full-time work for some of the existing workforce, and also some of the new workers taking on full-time roles as tourism settled into its summer surge.
This aggregate shift towards full-time work was a net effect of a shift in the same direction for accommodations, recreation and entertainment, and travel services, offset by an increase in part-time work in transportation and food and beverage services. There has been a general shift towards more part-time work from June 2019, except in accommodations and travel services, which have both seen a decrease in part-time work (substantially larger for accommodations than for travel services).
Hours Worked
Another useful metric for assessing the stability of the tourism workforce is to look at total hours worked, as this index is more responsive to short-term changes in demand than raw employment numbers. When customer demand increases, it is quicker and easier for employers to schedule more hours for existing staff than to increase their employee roster; longer-term changes in demand will have an effect on staffing numbers, but only once operators are confident that conditions will persist.
Figure 2 provides a snapshot of hours worked in tourism in June 2025, in May 2025, and over the past three years. The dotted line represents the pre-pandemic baseline from 2019.
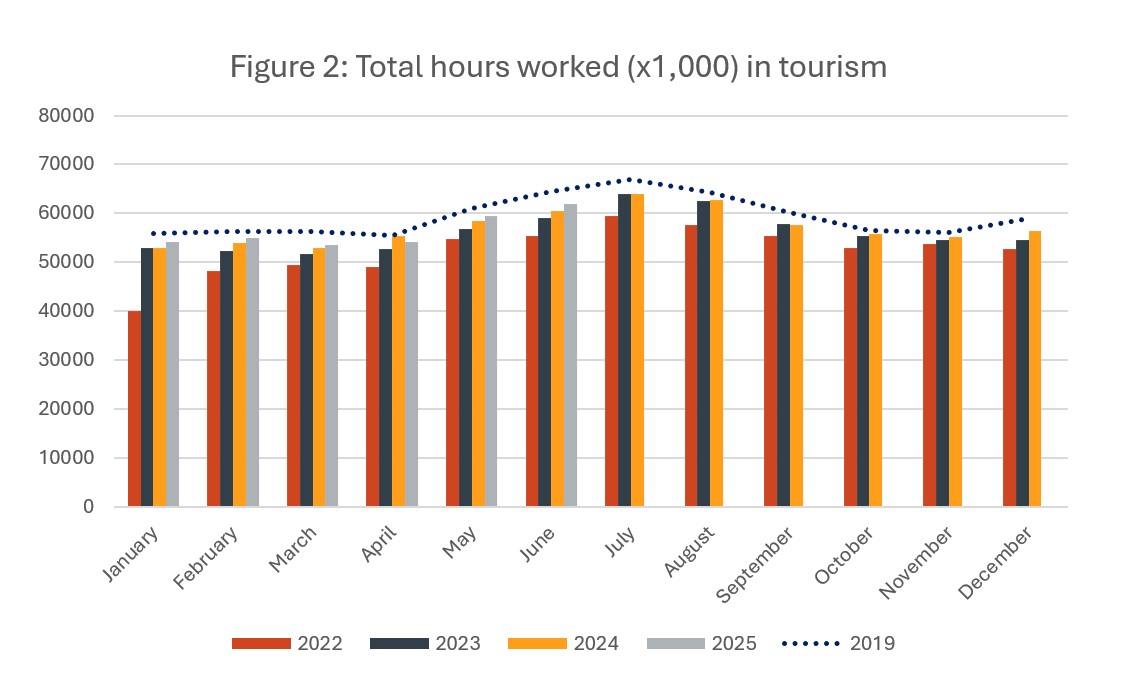
June 2025 saw an increase in tourism hours worked from May (+4.3%), which was slightly larger than the increase in employment (see Table 2, above), accounting for the increase in full-time work (Figure 1). There was also an increase over last year, continuing the general trend of year-over-year growth, although the June 2025 figure remained around 4% below 2019 levels.
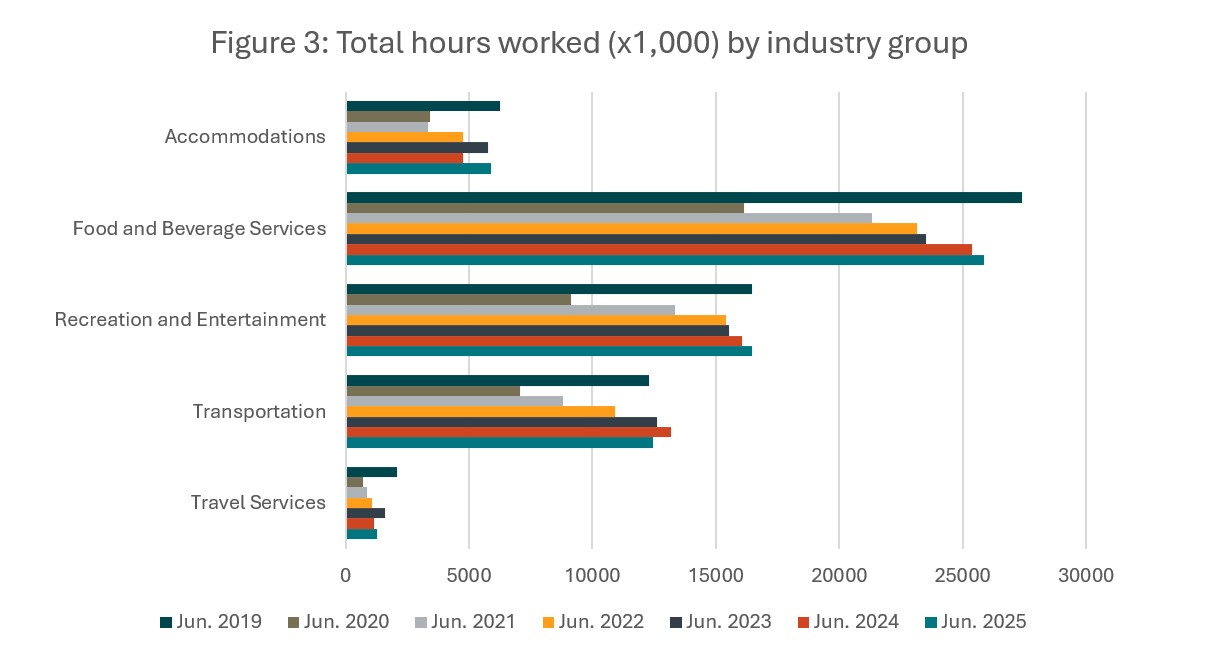
When considered through an industry lens (Figure 3, covering annual June data back to 2019), most industries saw an increase over 2024 in terms of hours worked. Only transportation had surpassed 2019 levels (+1.4%), although this also represented a decrease over last year. The transportation industry group includes urban transit workers, school bus drivers, and ride-sharing drivers (who operate as independent contractors), so this figure may be particularly dependent on external social factors and sensitive to a slightly different seasonal variation than some of the other industries.
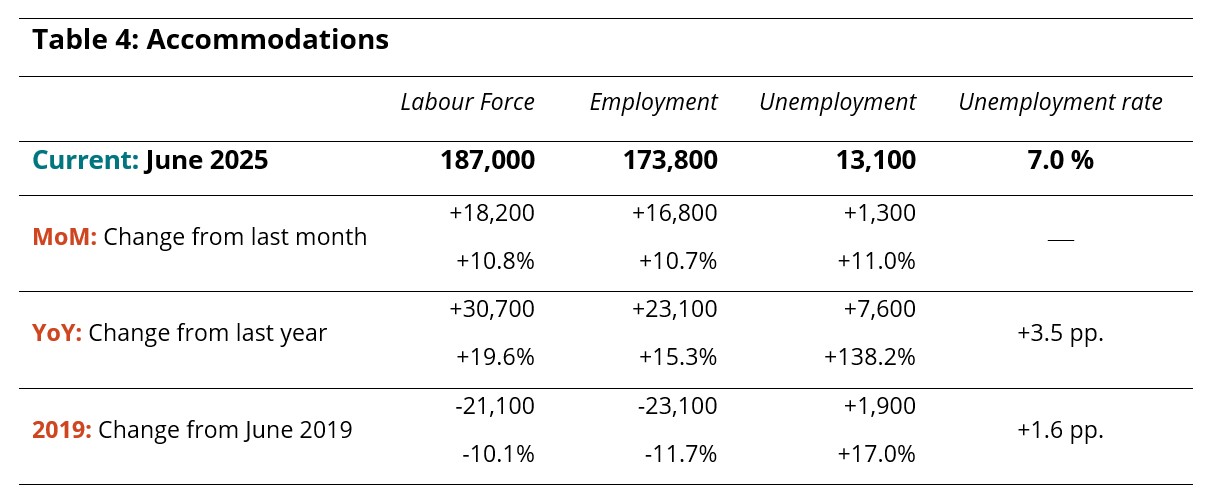
Industry Closeup: Accommodations
The accommodations industry has had a slow recovery path following the pandemic, although things have been picking up in recent months. June 2025 saw nearly 17,000 people enter work in this industry, an increase of around 10% on May 2025 and around 15% on June 2024 (Table 4).
The number of unemployed persons in this industry also increased from May, but the increase was proportionate to the gains in labour force, so the unemployment rate held steady at 7%. Both labour force and employment were 20,000+ people short of the June 2019 benchmark.
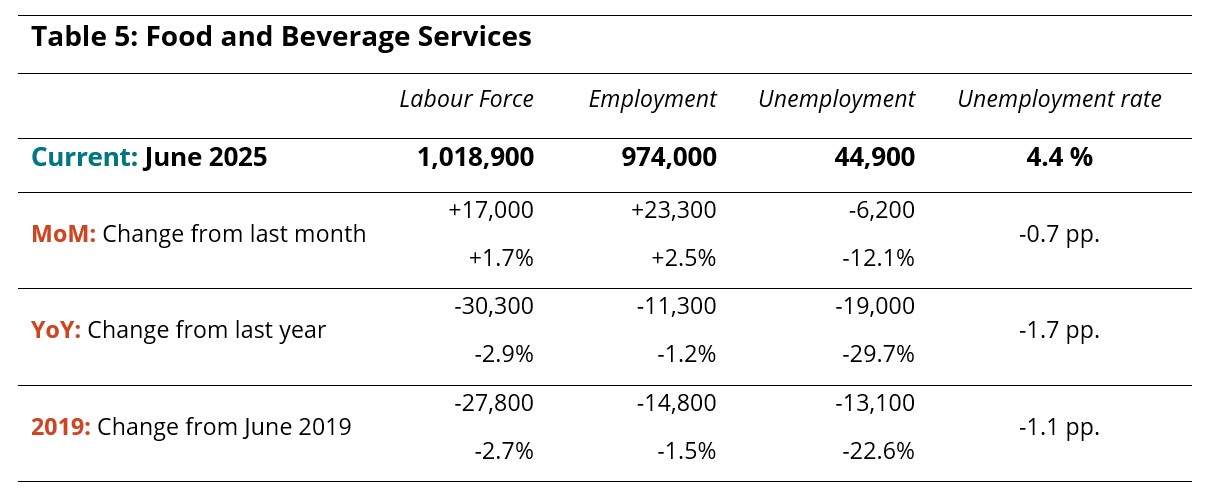
Industry Closeup: Food and Beverage Services
Food and beverage services was the largest employment group in the tourism sector, with over one million people in its labour force as of June, and just short of 975,000 people working (Table 5). Although there were modest increases from May on both labour force and employment, the industry remained below where it was last year. The unemployment rate in June was below the average over the past 12 months, indicating a tight labour market generally.
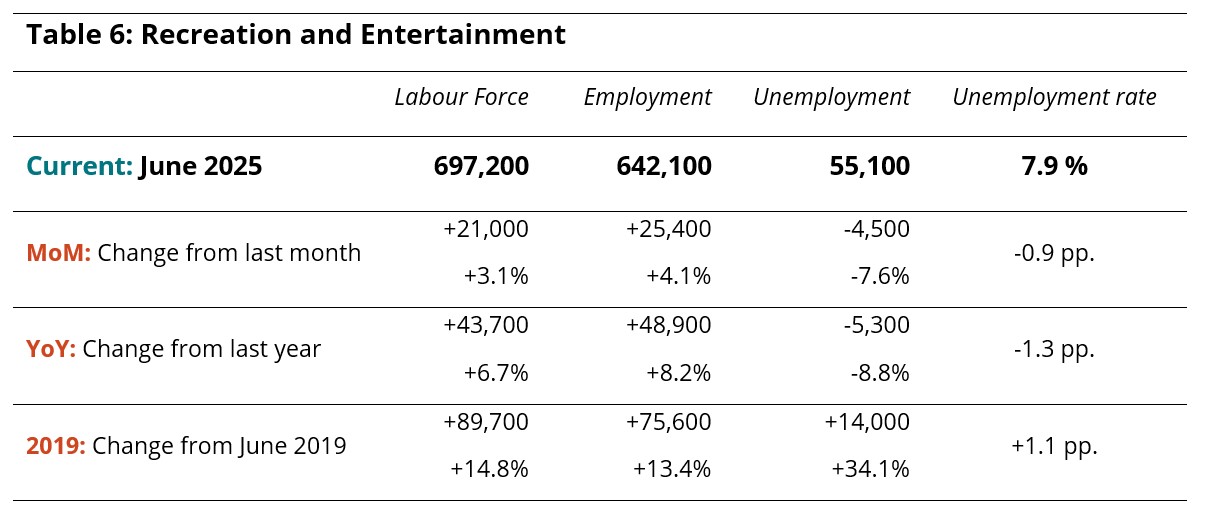
Industry Closeup: Recreation and Entertainment
Recreation and entertainment has shown fairly consistent growth over the past year, within the parameters of regular seasonal variation, and June 2025 was no exception. The labour force reached almost 700,000 people, and over 25,000 people entered work from May (Table 6). Growth from last year was even stronger, and employment in the industry has had a net increase of over 75,000 people since June 2019. The unemployment rate in June was around 1 percentage point lower than in May.
Industry Closeup: Transportation
While transportation is one of the industries that has regularly surpassed 2019 levels of employment over the past year, June proved to be a difficult month. The labour force shrank by 2.7% from May, and employment likewise fell by 1.6% (Table 7); both indices remained below June 2024 levels as well. More people left the labour force than left employment, which pulled the unemployment rate down to 1.7%.
Part of this change may be seasonal, with some operators—drivers in particular—picking up work in other sectors as the school year ended. The decrease on last year, however, suggest that something more structural may be occurring, although it will take a few more data points to have a sense of a larger shift in labour trends.

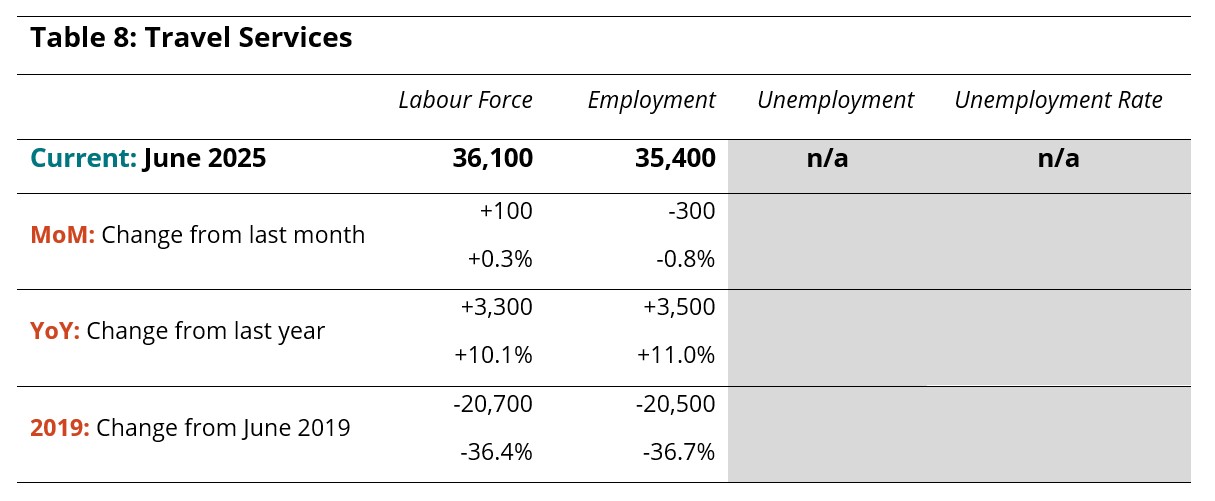
Industry Closeup: Travel Services
As noted earlier, data for travel services is not always reliable. It is subject to data suppression from Statistics Canada, and the sampling methods used in the LFS may distort the magnitude of some changes when individual responses are scaled up to reflect population level trends. Where patterns have been more consistent—such as the overall diminishment of the industry relative to pre-pandemic workforce levels—we can have more confidence.
The sector was largely unchanged from last month (Table 8), and seems to have grown over last year, although this is the scale at which the numbers become questionable, based on the sampling size. Both employment and labour force figures remained around 36% below 2019 levels.
Provincial Perspectives
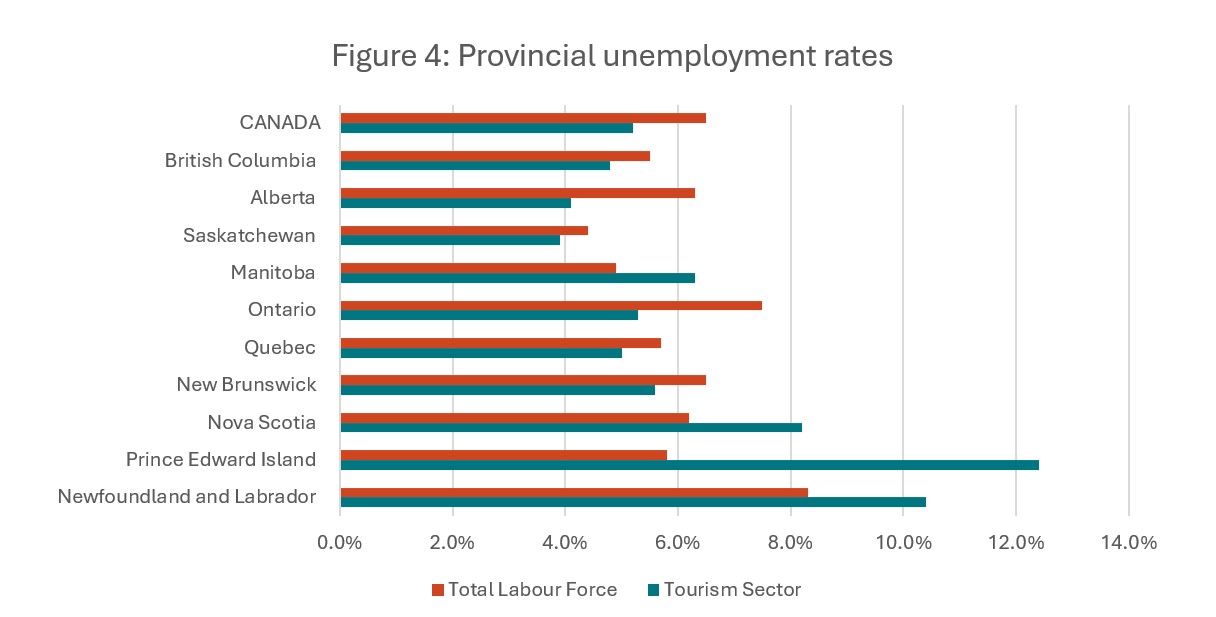
The Canadian economy is subject to some pronounced regional differences, and that is particularly true in the tourism sector. Figure 4 provides a comparison of provincial unemployment rates, for the tourism sector in particular, and for the total labour force (i.e., comprising all sectors and industries).
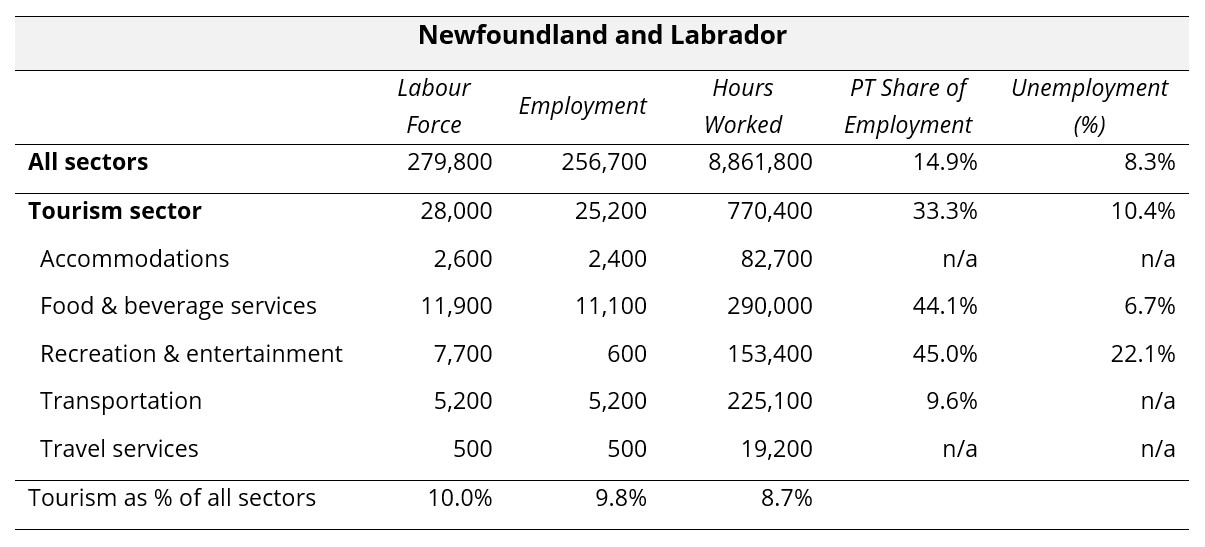
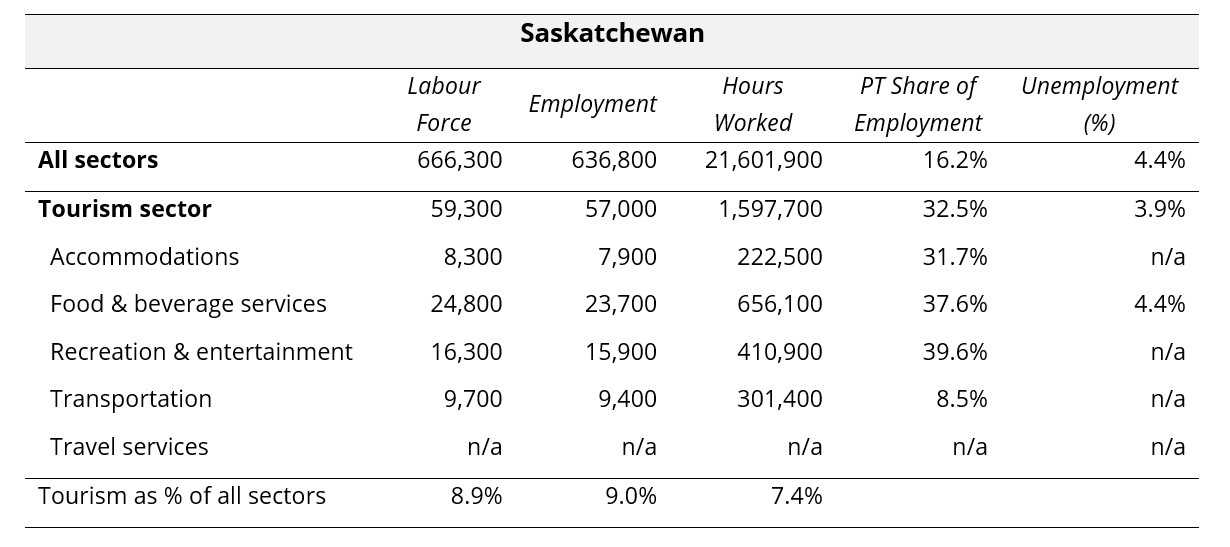
In most provinces, tourism unemployment rates were lower than they were across the total labour force, although not in Manitoba, Nova Scotia, Prince Edward Island, or Newfoundland and Labrador. This pattern is not uncommon in the Atlantic region, where the summer bump may start a bit later than in other areas. It is not particularly characteristic of Manitoba, however, and it is likely that the widespread wildfires across much of the province have affected employment in tourism businesses. The highest provincial tourism unemployment rates in June were in Prince Edward Island (12.4%) and Newfoundland and Labrador (10.4%), while the lowest were in Saskatchewan (3.9%) and Alberta (4.1%).
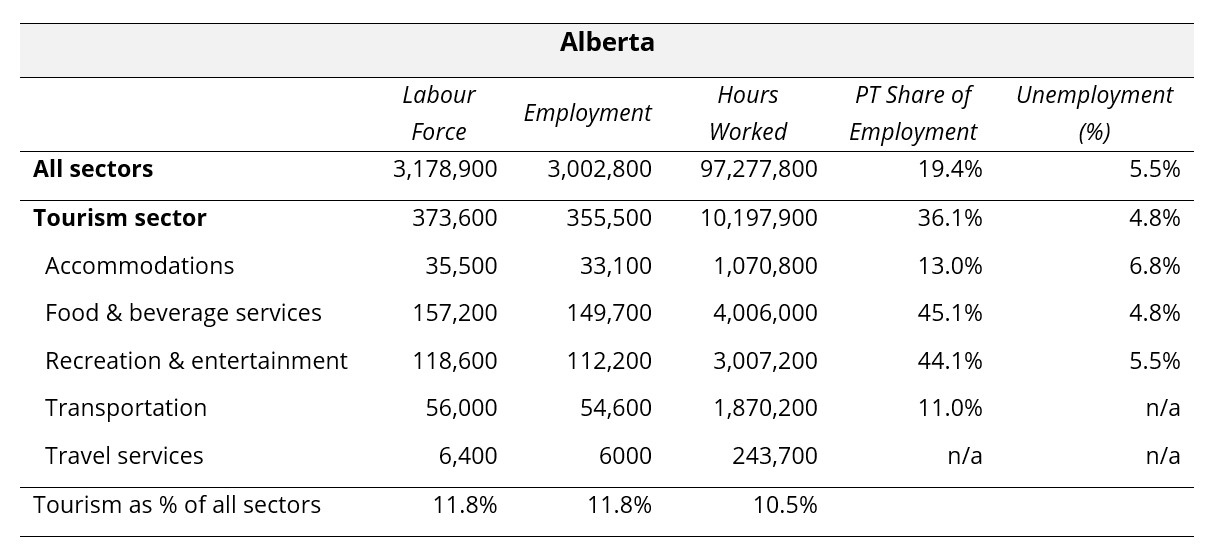
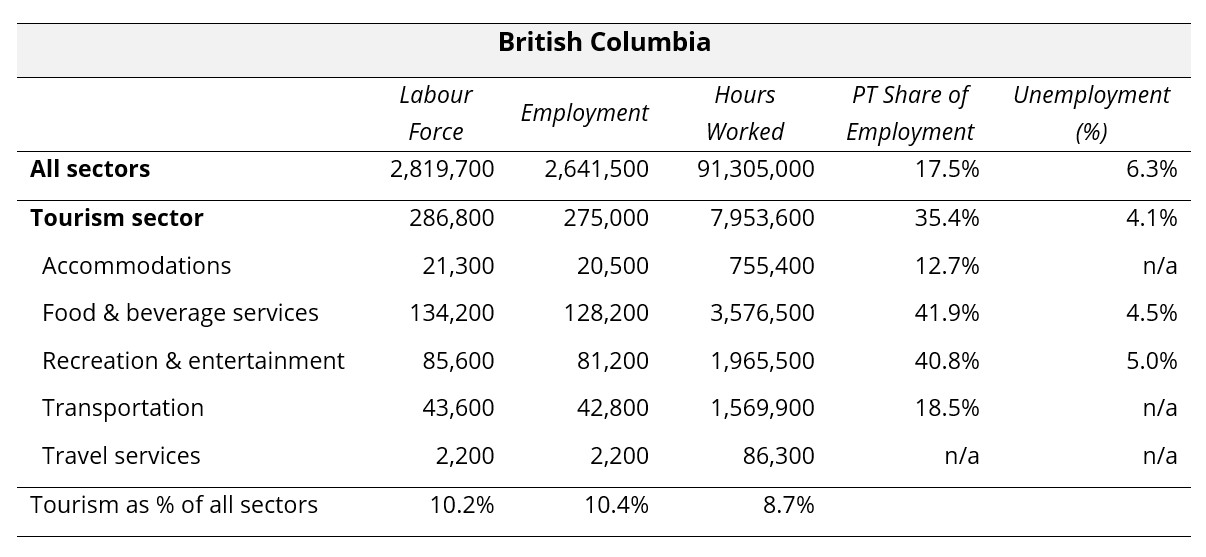
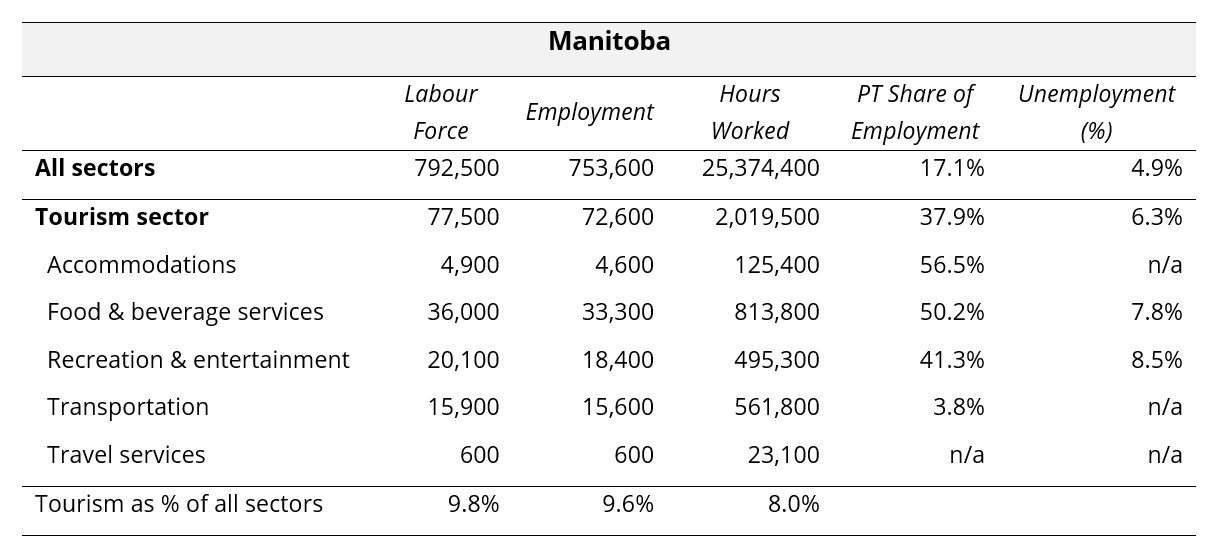
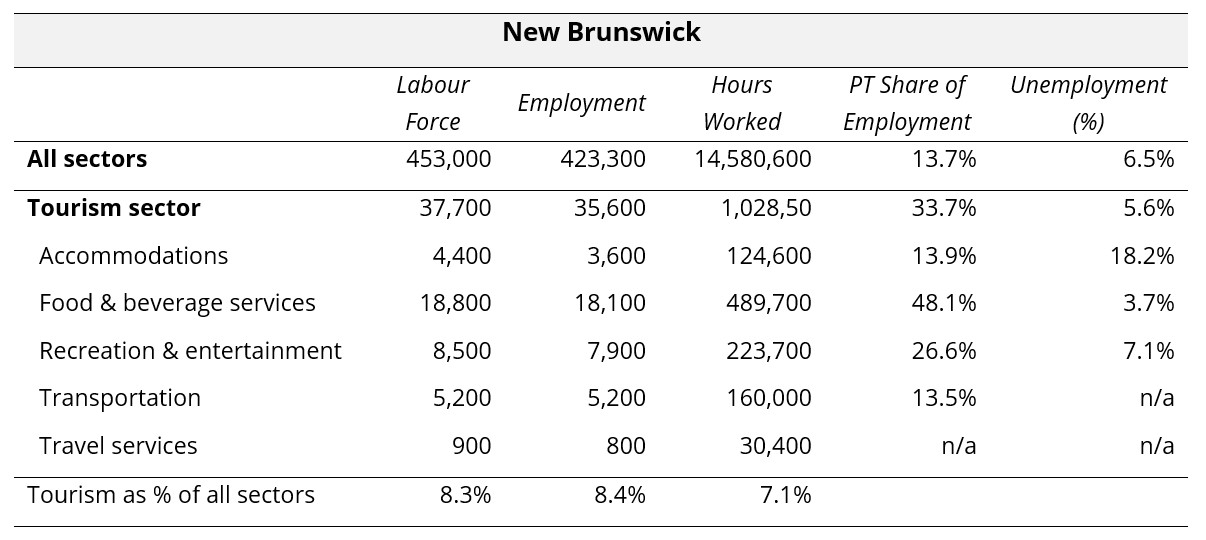
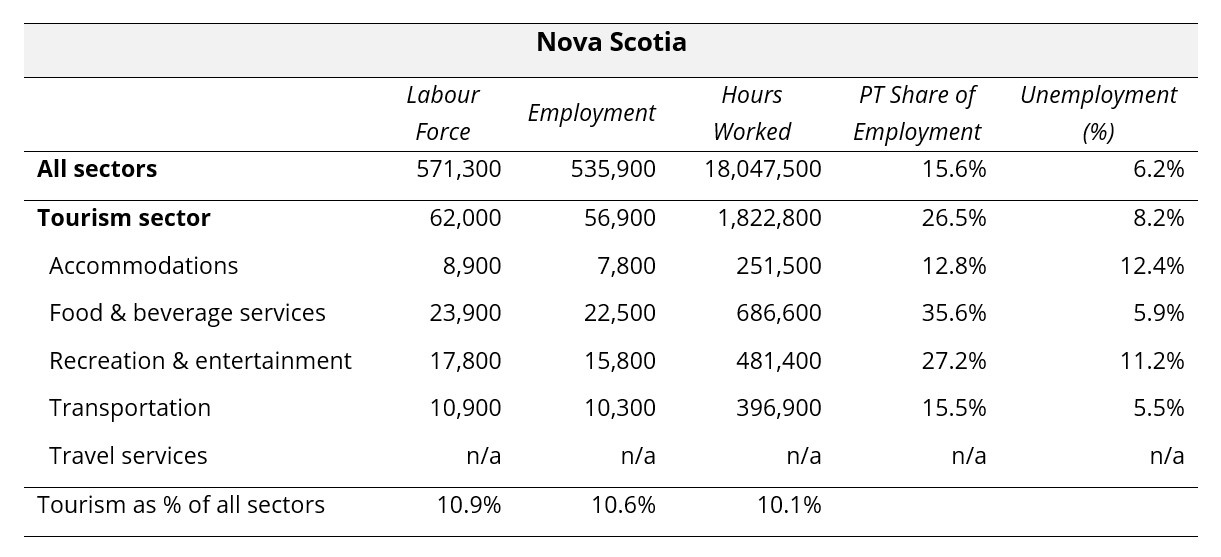
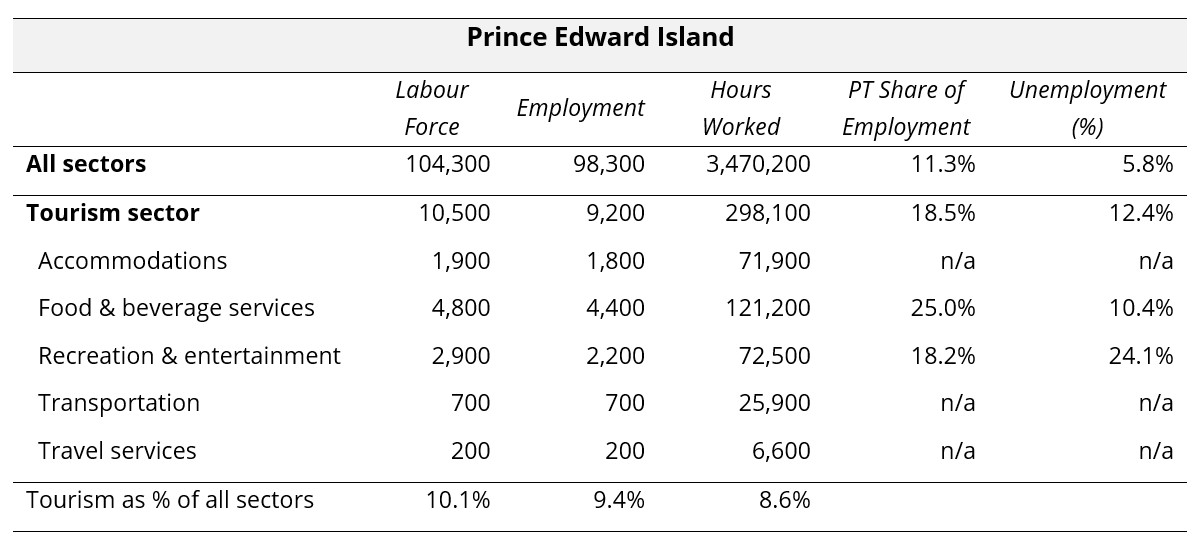
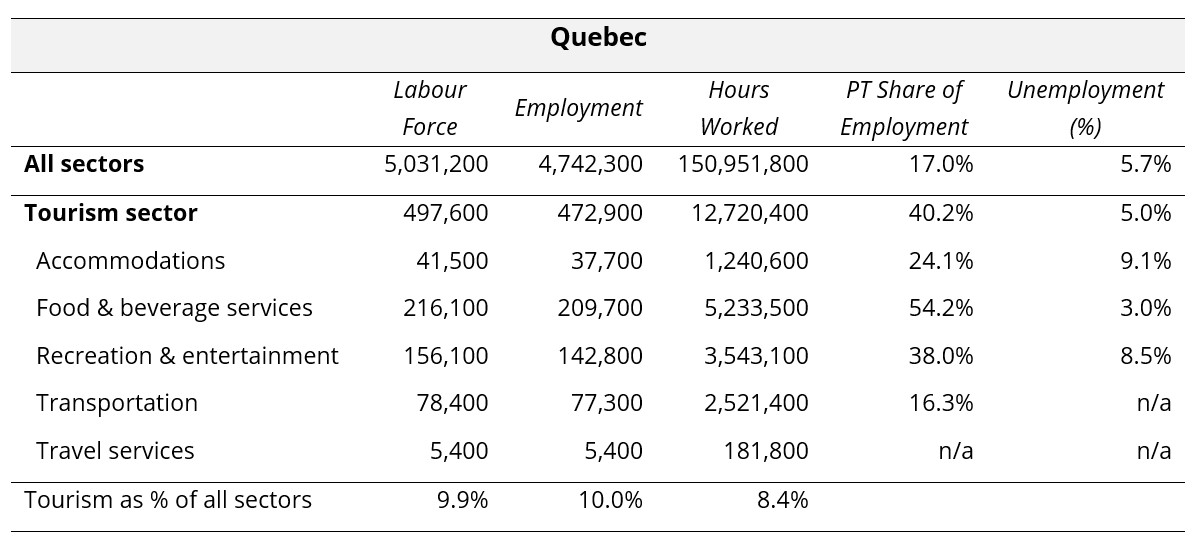
Provincial Summaries for June 2025
The following ten tables provide June 2025 summaries for the provinces, focusing on tourism and its five industry groups. Comparison data is provided for the larger provincial economy, as a benchmarking reference. Seasonally unadjusted estimates are provided for labour force, employment, and hours worked, and the final row of each table indicates tourism’s share of each of these metrics. The share of work that is part time (as opposed to full time) is provided, as a rough indicator of the labour force composition, and unemployment rates are also given.
Where data was not available due to suppression from Statistics Canada, “n/a” has been entered in the table. The three territories are not included in the LFS releases at this level of granularity, so no comparison is possible between the territories and the provinces. The provinces are listed alphabetically.

View more employment charts and analysis on our Tourism Employment Tracker.
[1] As defined by the Canadian Tourism Satellite Account. The NAICS industries included in the tourism sector those that would cease to exist or would operate at a significantly reduced level of activity as a direct result of an absence of tourism.
[2] SOURCE: Statistics Canada Labour Force Survey, customized tabulations. Based on seasonally unadjusted data collected for the period of June 15 to 21, 2025.