Tourism Employment Stays Strong.
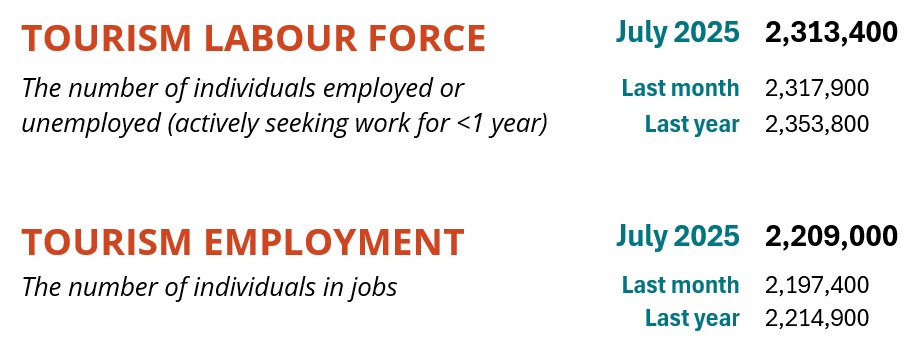
The tourism sector[1] in July 2025 grew by around 3% from where it stood last month[2], and was generally in a stronger position than last year. Given the strong economic headwinds facing the economy, and the decrease in visitors from the United States, domestic interest in travel seems to be enough to sustain the demand side of the equation, at least for the time being.
At the industry group level, only transportation saw a slight drop in employment, with all other industry groups showing reasonable growth in both labour force and employment. The sector was also in a much stronger position relative to last year, although there was more variability across industries when comparing July 2025 with July 2019.
Table 1 provides a snapshot of each industry group’s performance across labour force, employment, and unemployment, as compared with June 2025 [MoM], July 2024 [YoY], and July 2019 as a pre-pandemic baseline. Small arrows represent changes of less than 1% (or one percentage point, in the case of unemployment).
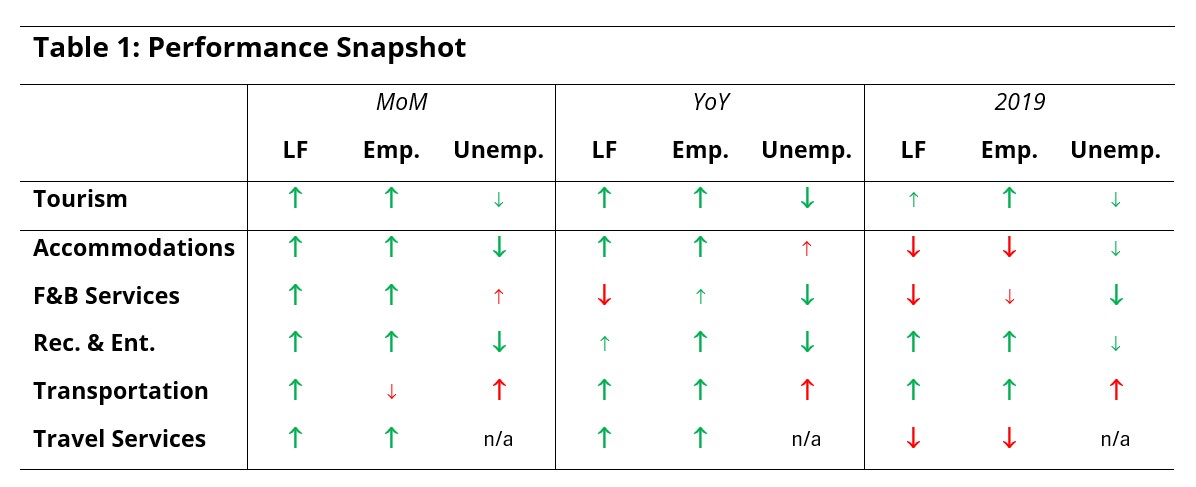
July is generally a strong month for the tourism labour force, with demand increasing as families take vacations, and with high school students entering the labour market to take up summer jobs, many of which are in tourism. Year-on-year growth was fairly consistent, with only food and beverage services seeing loss in labour force — although it also had a slight gain in employment, which pulled down the unemployment rate. Consistent with the past several months, growth relative to 2019 was driven entirely by gains in recreation and entertainment and in transportation.
Tourism Sector
The tourism sector in Canada saw around 80,000 people enter employment in July, an increase of 3.7% from June and 2.8% from last year (Table 2), nudging the employment number to just over 2.2 million people. The tourism labour force reached 2.3 million, with around 100,000 people unemployed.
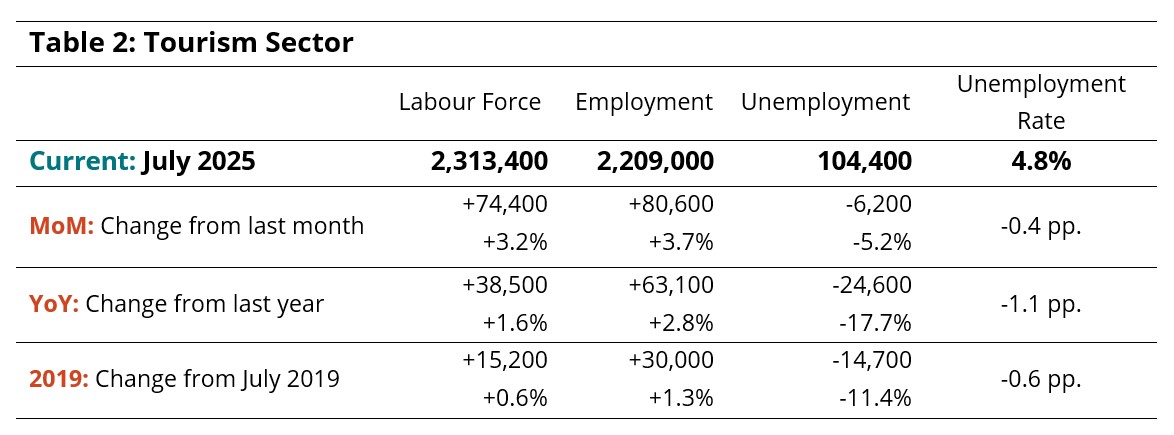
Gains in employment outpaced those in labour force, lowering the unemployment rate to 4.8% (seasonally unadjusted). This was around 2.4 percentage points lower than the economy-wide national average (7.2%, seasonally unadjusted).

While tourism employment and labour force ticked upwards, those of the larger economy edged downward and saw an increase of 160,000 people in unemployment (Table 3). Tourism employment accounted for 10.7% of all employment in Canada in July, and 10% of the overall Canadian labour force was employed in a tourism industry. Both these shares were slightly higher than in June.
Part-Time and Full-Time Employment
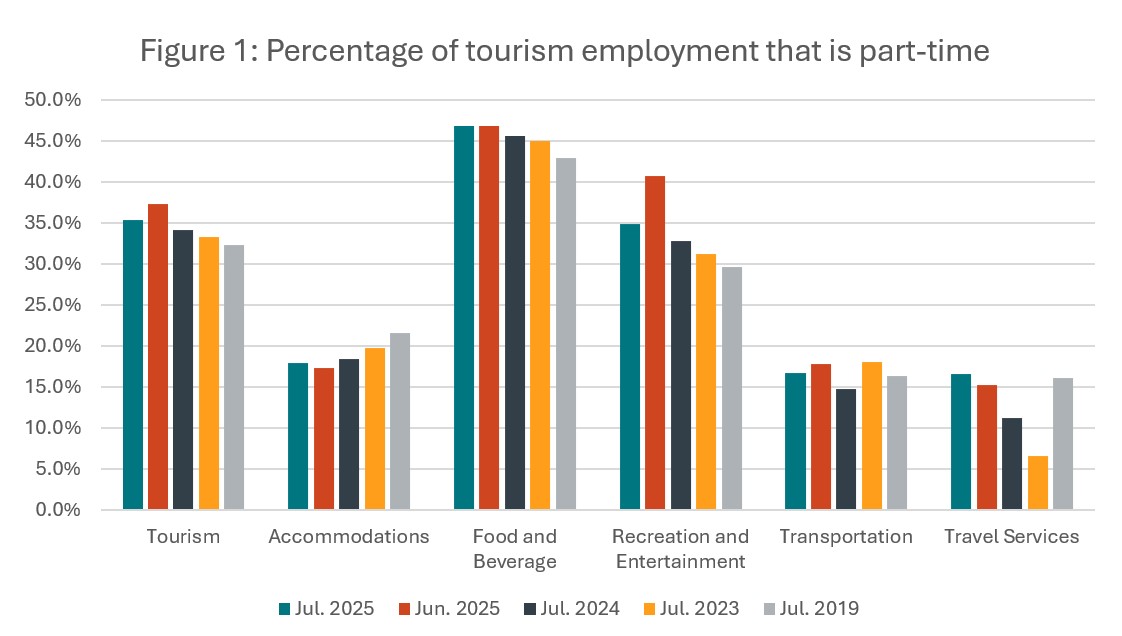
The ratio of part-time to full-time work provides an interesting perspective on the long-term stability of the tourism workforce[3]. From June to July this year, the sector overall saw a slight decrease in part-time employment (Figure 1), which is not surprising as businesses ramped up their operations and high school students who worked part-time hours through the academic year could take up additional hours.
The largest shift occurred in recreation and entertainment, which saw a decrease from June of over 5 percentage points in part-time employment. Over the past several years, there has been a gradual shift towards more part-time work, a trend particularly evident in food and beverage services and recreation and entertainment, but countered in a gradual shift towards full-time work in accommodations. Transportation has generally remained fairly stable.
Hours Worked
The number of hours worked is another useful metric for gauging the short-term stability of the workforce, as operators can scale hours worked more rapidly than they can hire or fire employees in response to fluctuations in customer demand.
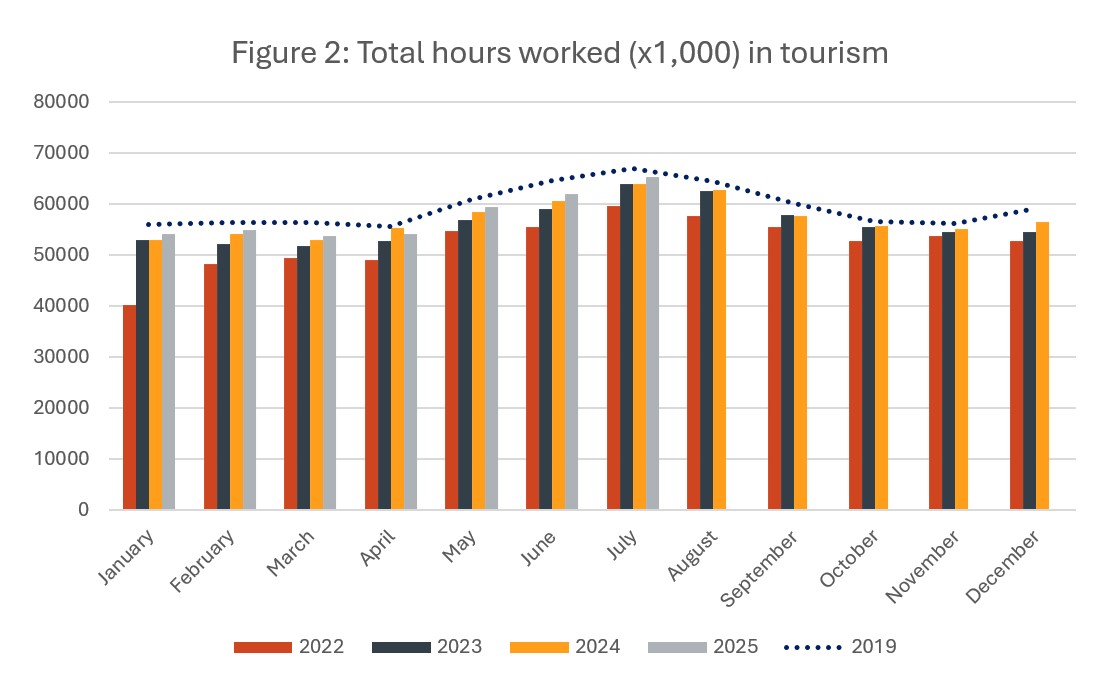
In July, total hours worked in tourism increased by around 5% from June (Figure 2), and were around 2% higher than they were last year. They remained slightly below 2019 levels, but the general trend of growth has continued year over year.
Figure 2 provides a snapshot of hours worked in tourism over the past three years. The dotted line represents the pre-pandemic baseline from 2019.
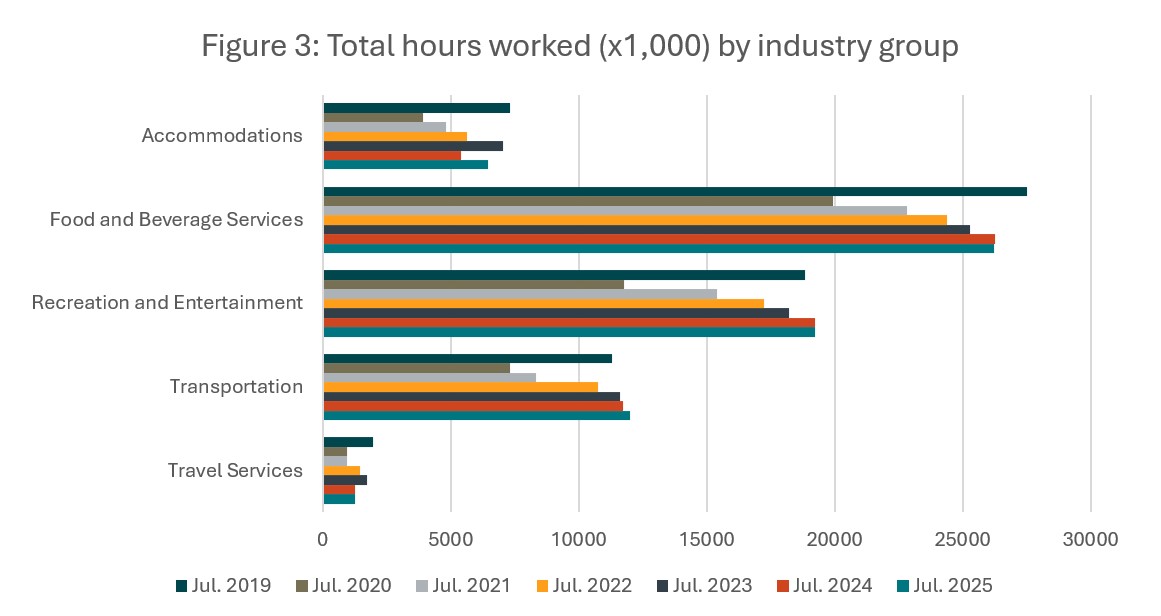
July 2025 saw an increase of nearly 10% in hours worked in accommodations relative to 2024 (Figure 3), although it looks as though this was largely because 2024 was a particularly low year. Hours worked have generally trended upwards from the pandemic lows of 2020, although that trend has slowed and possibly reversed for accommodations. Food and beverage services and recreation and entertainment both saw very slight declines from last year, while transportation saw slight gains. Recreation and entertainment and transportation alone surpassed July 2019 levels.
Industry Closeup: Accommodations
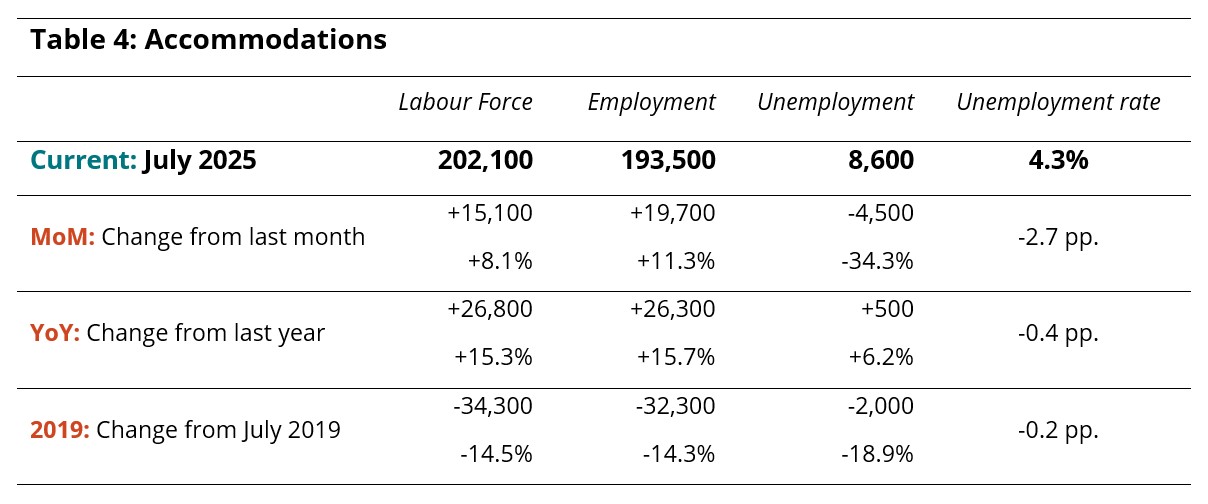
Accommodations saw substantial growth across both labour force and employment from last month, seeing nearly 20,000 people take up work in this industry. Although it remained below 2019 levels on both indices, it had surpassed last year’s levels quite comfortably. The unemployment rate was at 4.3%, a substantial decrease from June and comparable to that of last year.
Industry Closeup: Food and Beverage Services
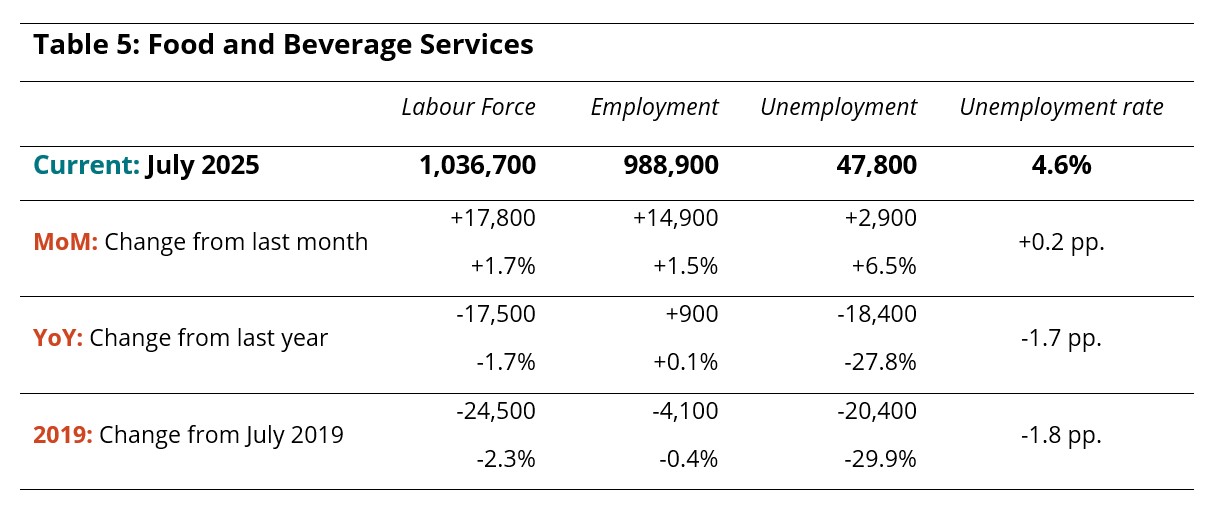
Food and beverage services has been slowing recently in its trajectory of post-pandemic growth. While it has grown from June with around 15,000 people taking up jobs, it lost around 17,000 people from its labour force since last year and remained slightly below 2019 levels. The unemployment rate was little changed from June, but had fallen by almost 2 percentage points relative to last year, suggesting a tighter labour market.
Industry Closeup: Recreation and Entertainment
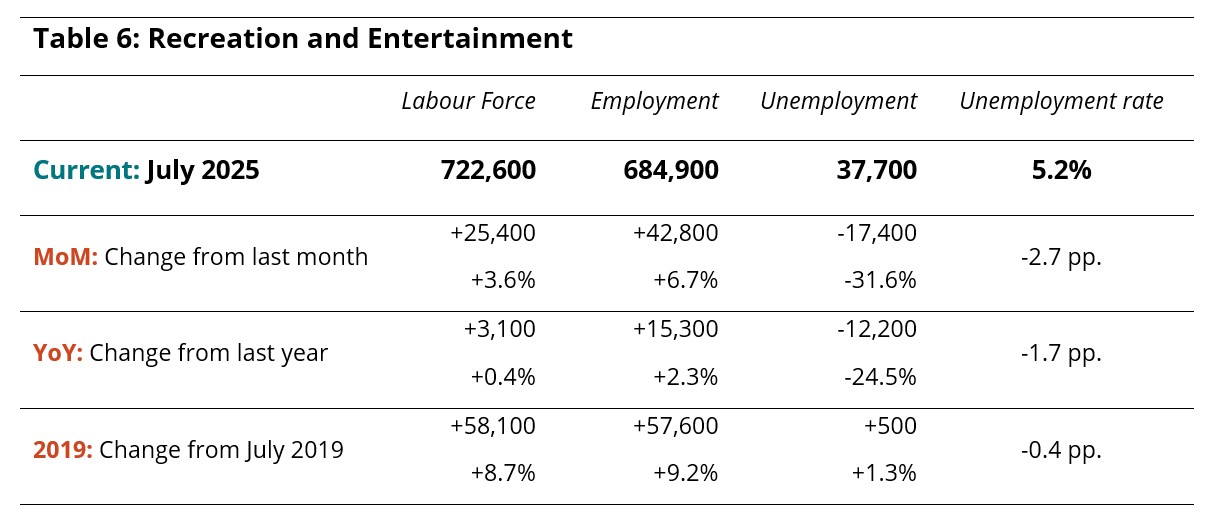
The recreation and entertainment industry continued its trajectory of growth from recent years, seeing gains in labour force and employment relative to June, to last year, and to 2019. Employment growth outstripped labour force gains, bringing the unemployment rate down by 2.7 percentage points to 5.2%.
Industry Closeup: Transportation
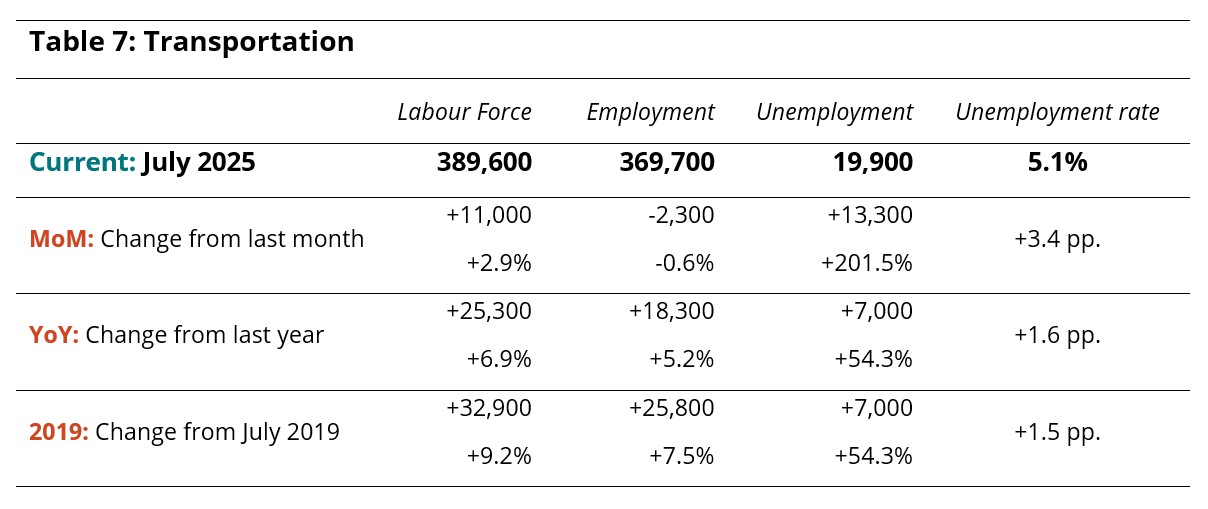
Employment fell marginally from June while labour force increased, adding 3.4 percentage points to the unemployment rate. However, relative to last year and to 2019, transportation remained in a stronger position. Gains in aviation-related employment were offset by losses in ground and water transportation.
Industry Closeup: Travel Services
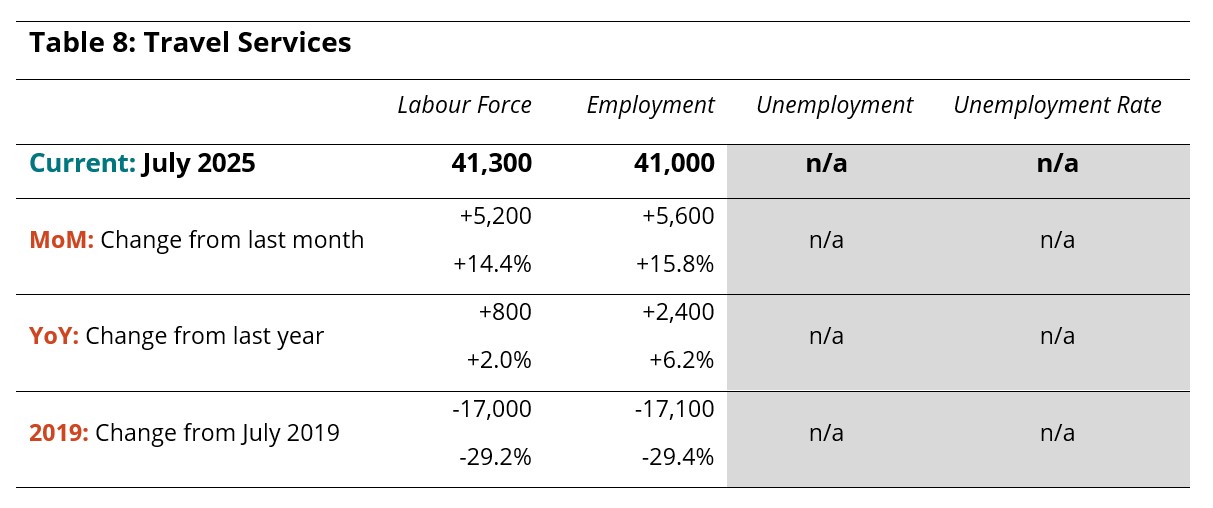
Due to its small size within the tourism sector and the sampling methodology of the Labour Force Survey, data relating to travel services tends not to be very reliable. The data provided below is indicative of recent developments, but should not be seen as an accurate snapshot of a given moment in time.
Provincial Perspectives
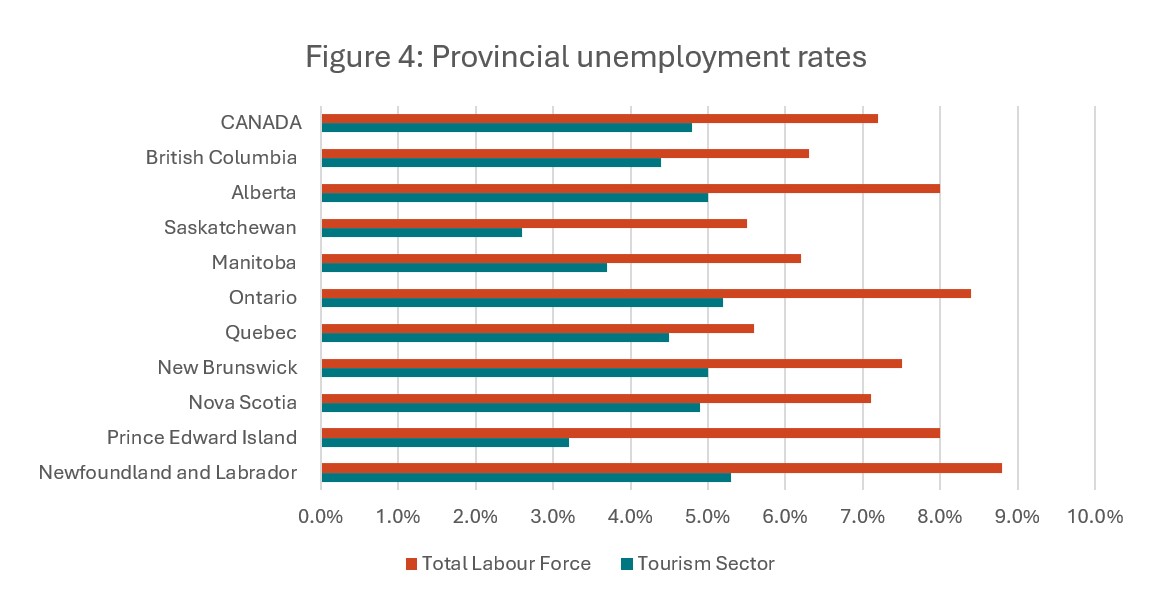
The Canadian economy is subject to some pronounced regional differences, and that is particularly true in the tourism sector. Figure 4 provides a comparison of provincial unemployment rates, for the tourism sector and for the total labour force (i.e., comprising all industries).
Across all provinces, tourism unemployment rates were lower than their economy-wide counterparts. This marks a substantial shift across the Atlantic provinces, which in non-peak periods tend to have substantially higher tourism unemployment rates. The highest tourism unemployment rates were in Newfoundland and Labrador (5.3%) and Ontario (5.2%), and the lowest were in Saskatchewan (2.6%) and Prince Edward Island (3.2%).
Provincial Summaries for July 2025
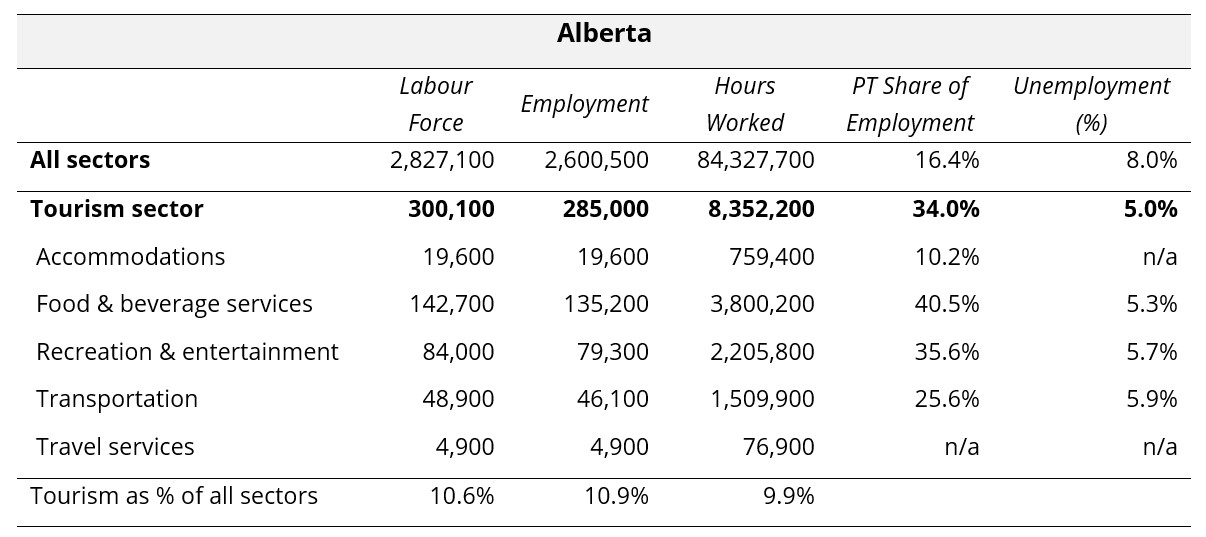
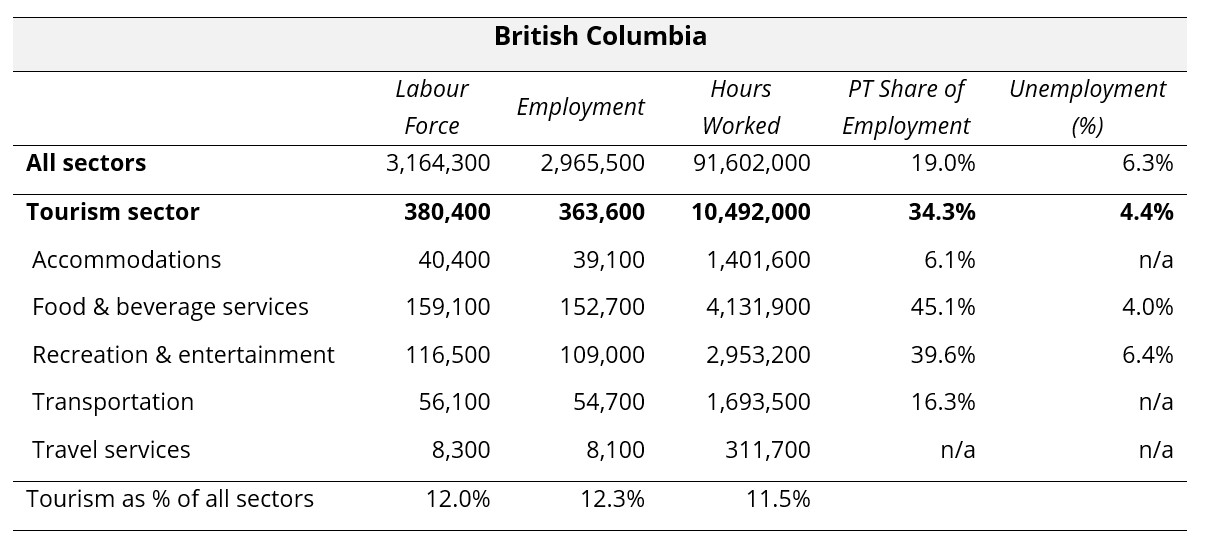
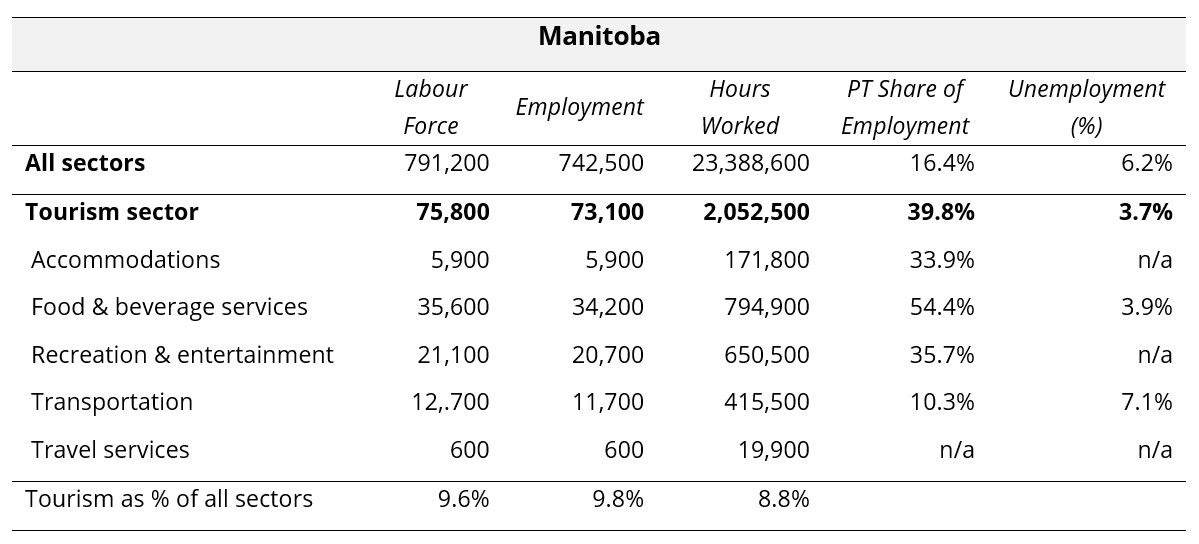
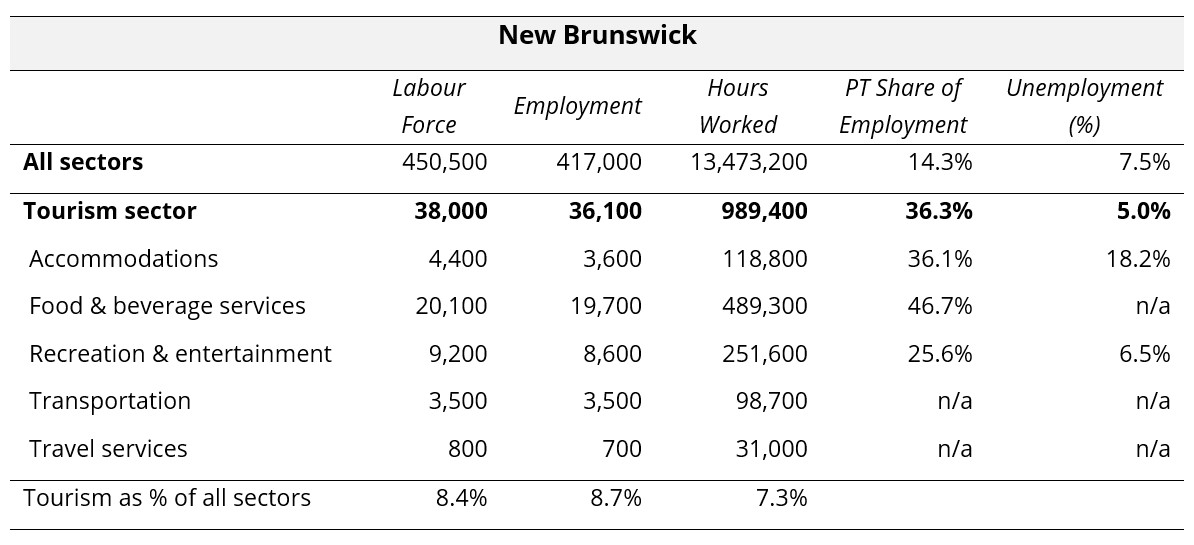
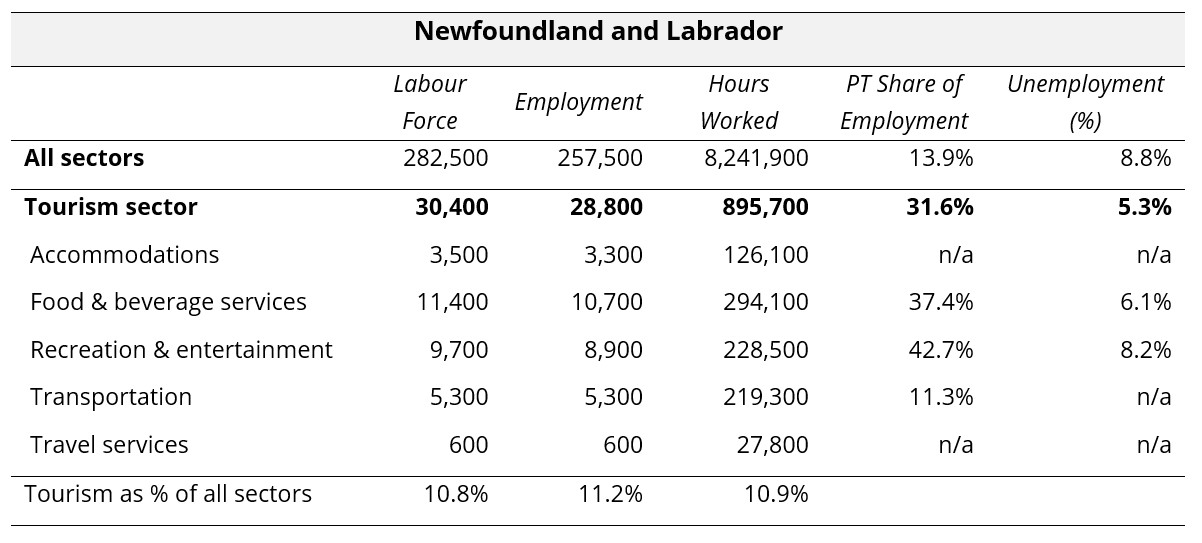
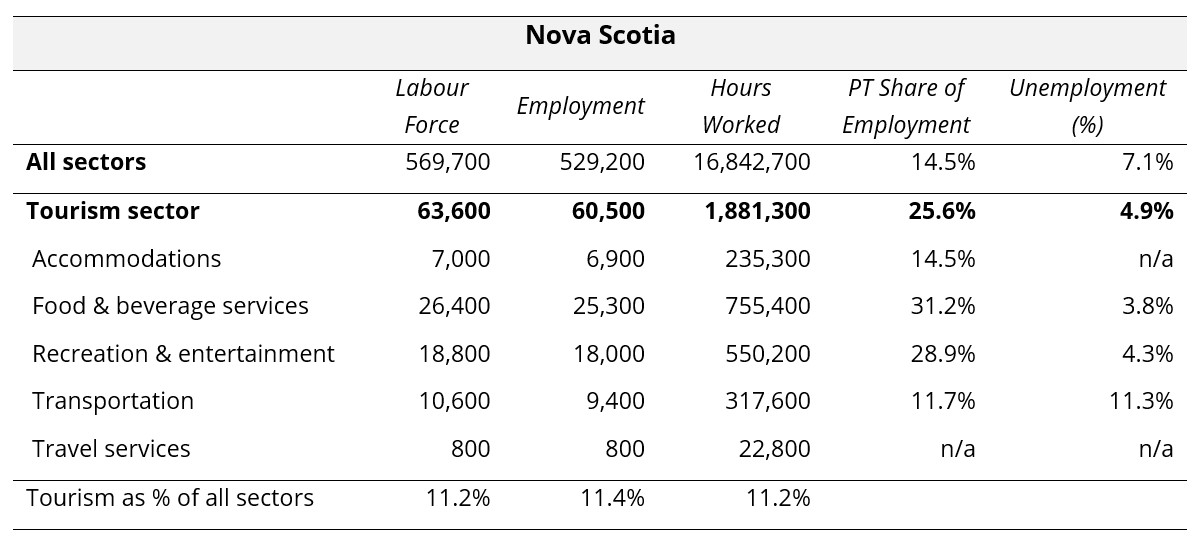
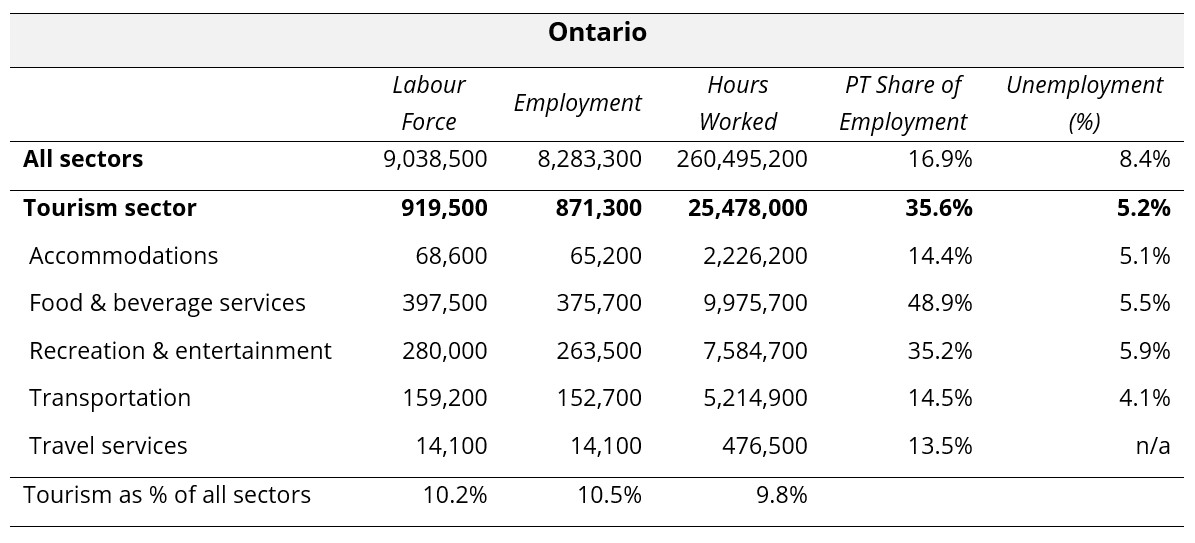
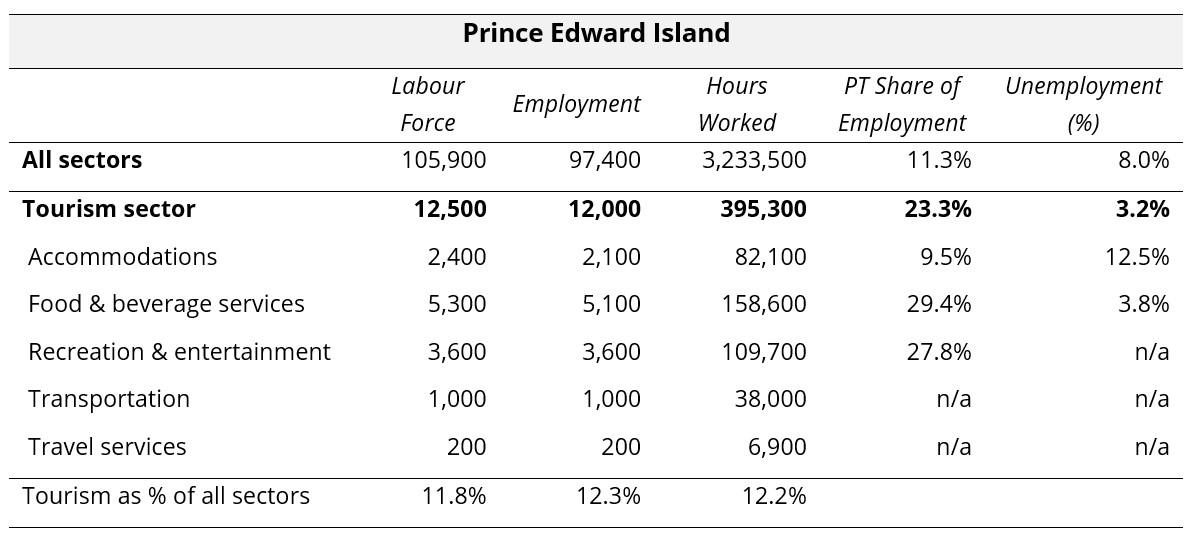
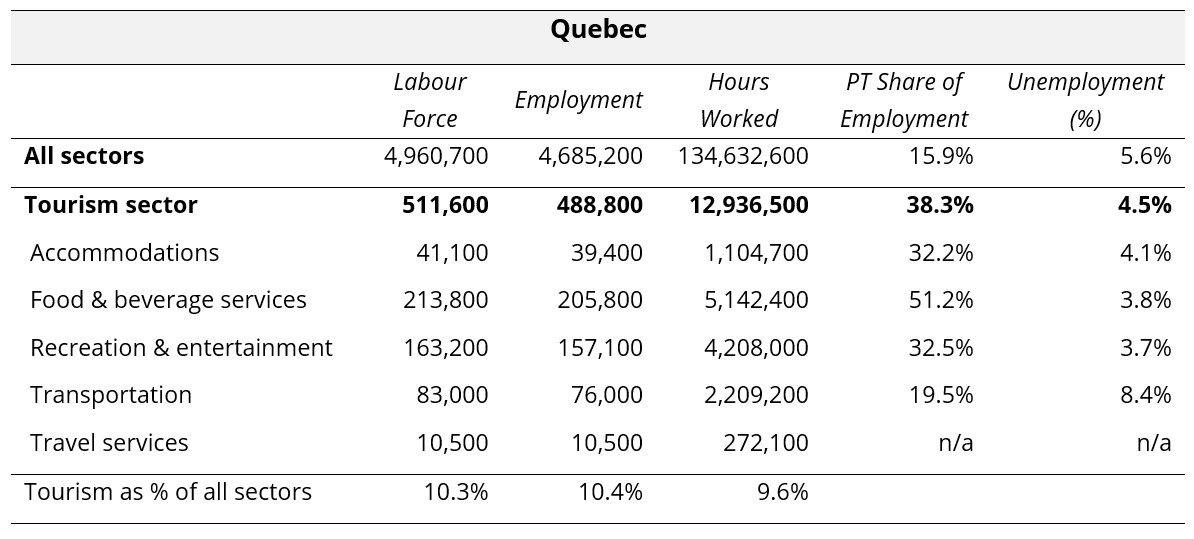
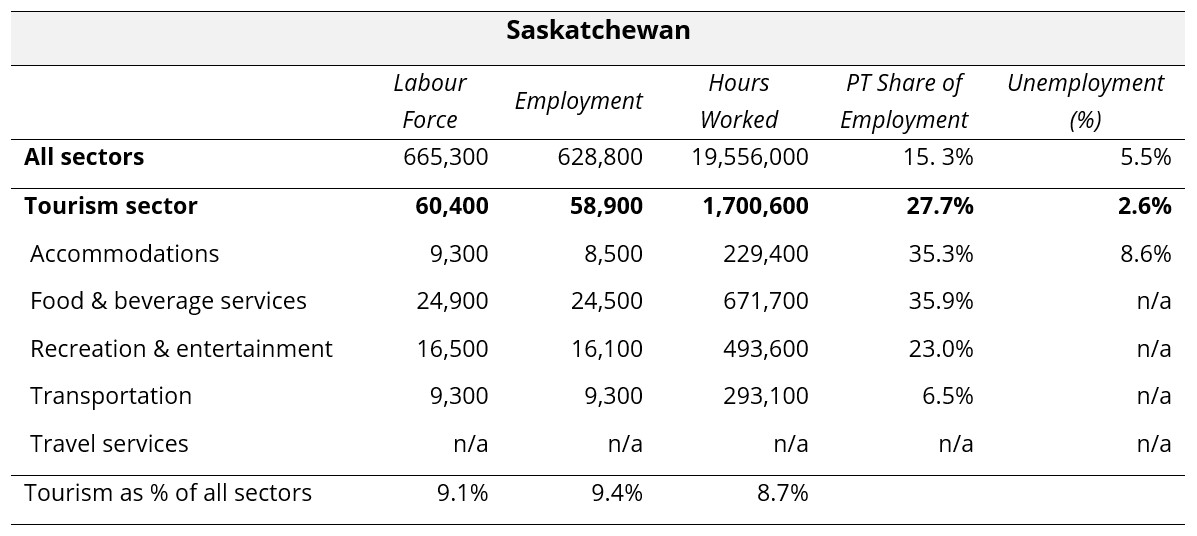
The following ten tables provide July 2025 summaries for the provinces, focusing on tourism and its five industry groups. Comparison data is provided for the larger provincial economy, as a benchmarking reference. Seasonally unadjusted estimates are provided for labour force, employment, and hours worked, and the final row of each table indicates tourism’s share of each of these metrics. The share of work that is part time (as opposed to full time) is provided, as a rough indicator of the labour force composition, and unemployment rates are also given.
Where data was not available due to suppression from Statistics Canada, “n/a” has been entered in the table. The three territories are not included in the LFS releases at this level of granularity, so no comparison is possible between the territories and the provinces. The provinces are listed alphabetically.
View more employment charts and analysis on our Tourism Employment Tracker.
[1] As defined by the Canadian Tourism Satellite Account. The NAICS industries included in the tourism sector those that would cease to exist or would operate at a significantly reduced level of activity as a direct result of an absence of tourism.
[2] SOURCE: Statistics Canada Labour Force Survey, customized tabulations. Based on seasonally unadjusted data collected for the period of July 13 to 19, 2025.
[3] The Statistics Canada threshold for full-time work is 30 hours per week.
