Early autumn sees tourism workforce contract, but hold its own.
September always sees a contraction of the tourism workforce: with the summer surge in demand definitively over and many students leaving the workforce to return to their studies, both labour force and employment dip.
The tourism sector[1] in September 2025 saw the expected decrease from August[2], although unemployment also edged down, which indicates that aggregate losses in the labour force outpaced those in employment. The picture relative to last year was much more positive, showing gains across labour force and employment, and a decrease in unemployment. The same pattern held at the sector level with respect to September 2019.
At the industry group level, there was overall stability relative to last month and last year: transportation alone saw gains from August, and food and beverage services alone saw losses from September 2024.
Table 1 provides a snapshot of each industry group’s performance across labour force, employment, and unemployment, as compared with August 2025 [MoM], September 2024 [YoY], and September 2019 as a pre-pandemic baseline. Small arrows represent changes of less than 1% (or one percentage point, in the case of unemployment).
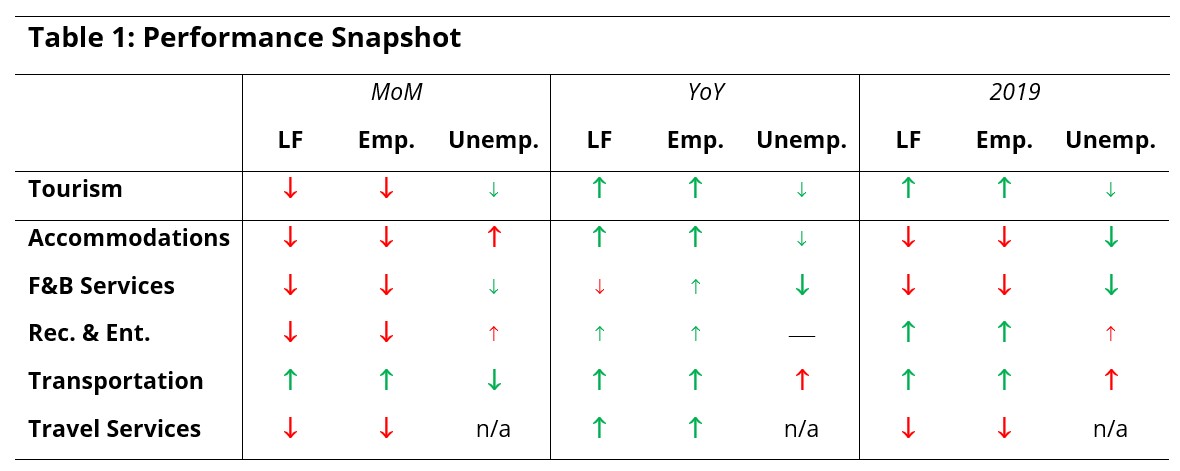
It is not historically uncommon for transportation to gain workers from August to September, likely linked to shifts in employment around public and school transit options at this time of year. All industry groups had higher employment numbers than last year, while only transportation and recreation and entertainment continued their overall trend of showing gains over 2019.
Tourism Sector
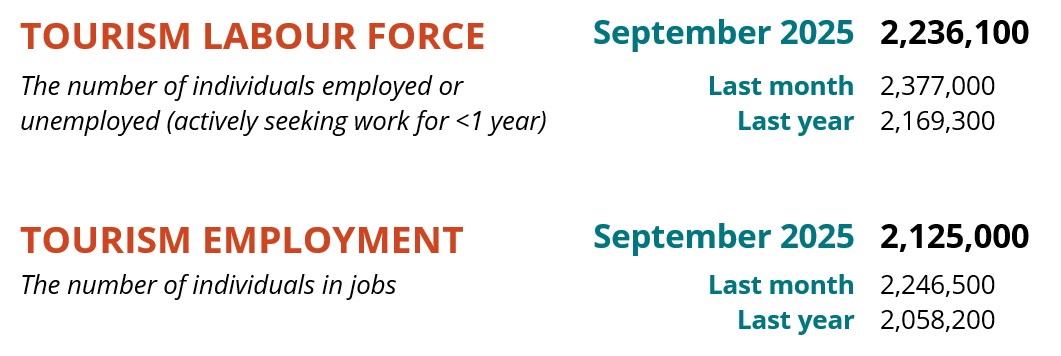
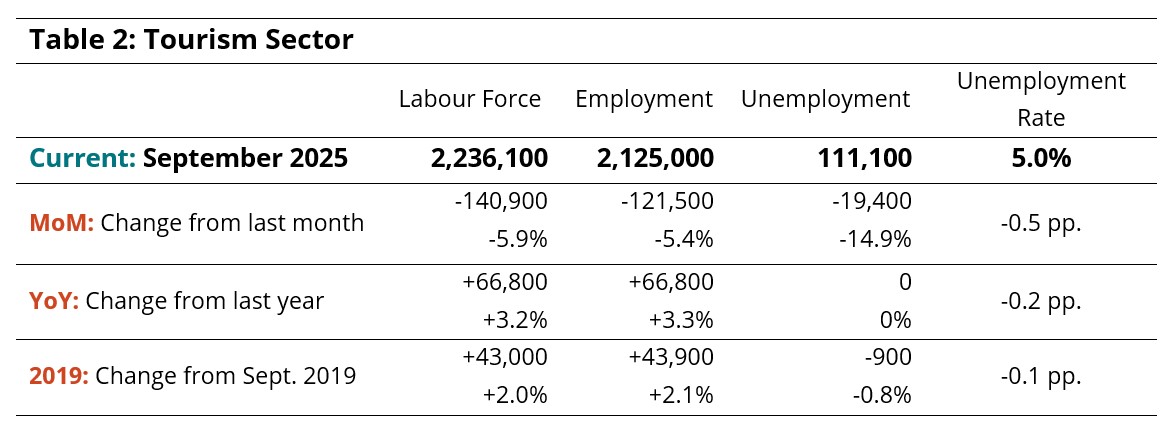
The tourism labour force stood at 2.2 million people in September (Table 2), a loss of around 141,000 people from August (-6%), but its position was stronger than it was last year, and it had surpassed 2019 levels. Employment also fell by around 5%, settling at 2.1 million. There were around 111,000 people unemployed, with a seasonally unadjusted unemployment rate of 5.0%. The lowered unemployment rate was due to more people leaving the labour force than leaving employment.
In spite of the seasonal headwinds, tourism’s position relative to the larger economy was not much changed from August (Table 3). Across all sectors, the unemployment rate lowered from 10.1% to 6.6% (calculated using seasonally unadjusted data), but this was not down to gains in employment but rather to substantial losses in labour force.
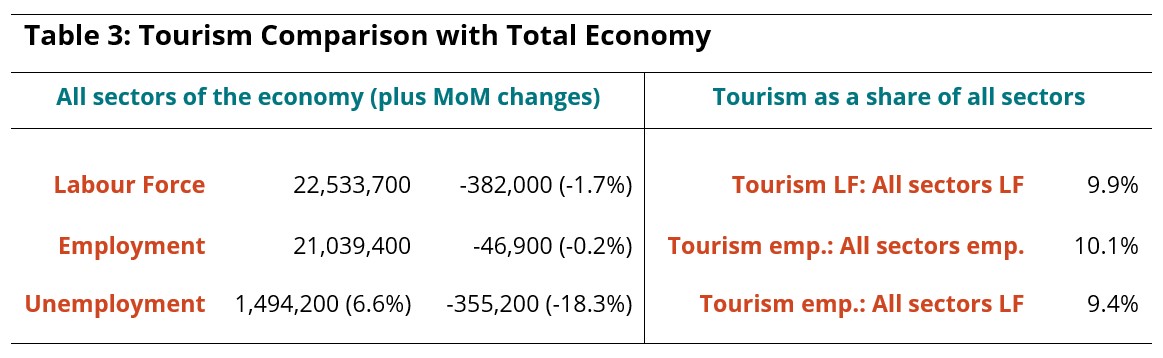
Tourism’s share of the total Canadian labour force and of all employment in Canada were both around 10%, while the percentage of the total Canadian labour force who were employed in tourism was 9.4% in September.
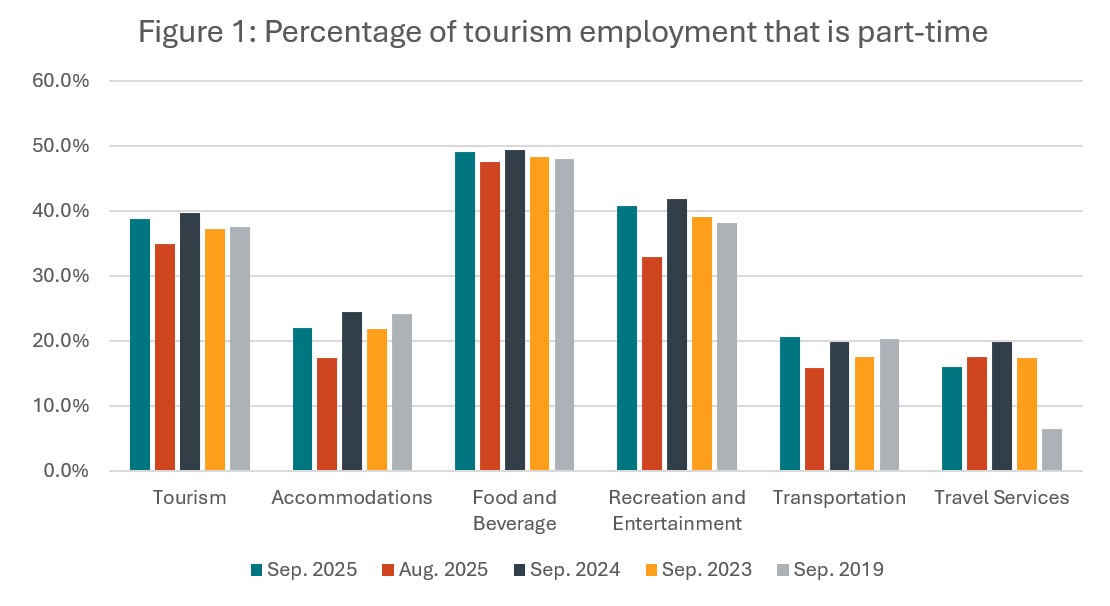
Part-Time and Full-Time Employment
The ratio of part-time to full-time work provides an interesting perspective on the stability of the workforce, as different industries rely to different degrees on part-time work, but reducing hours remains a useful tool for businesses to retain their workforce during lean times.
Figure 1 shows an increase in part-time work from August across most industries (the exception being travel services), but otherwise reasonable stability over the past few years and a return to pre-pandemic ratios. The exception is travel services, which has been extremely negatively impacted by both the pandemic and by the growth of online and self-service travel arrangement options. Overall, however, this does suggest that the tourism sector is broadly returning to familiar patterns of stability, even against the backdrop of a rapidly shifting economic environment.
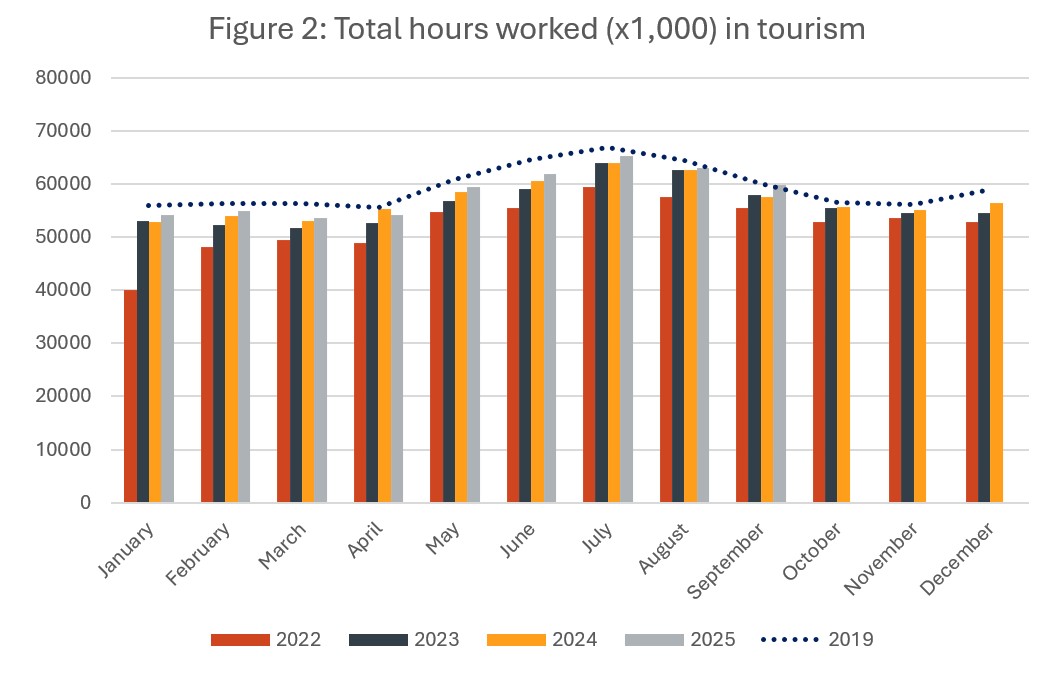
Hours Worked
The number of hours worked provides another useful perspective on the stability of the workforce, in that this metric is more sensitive to short-term changes in tourism demand than employment figures in isolation. Total hours worked in September fell slightly from August (-4.9%), which is a seasonal norm, but grew over last year (+3.9%), and the gap with 2019 narrowed to 0.5 percentage points.
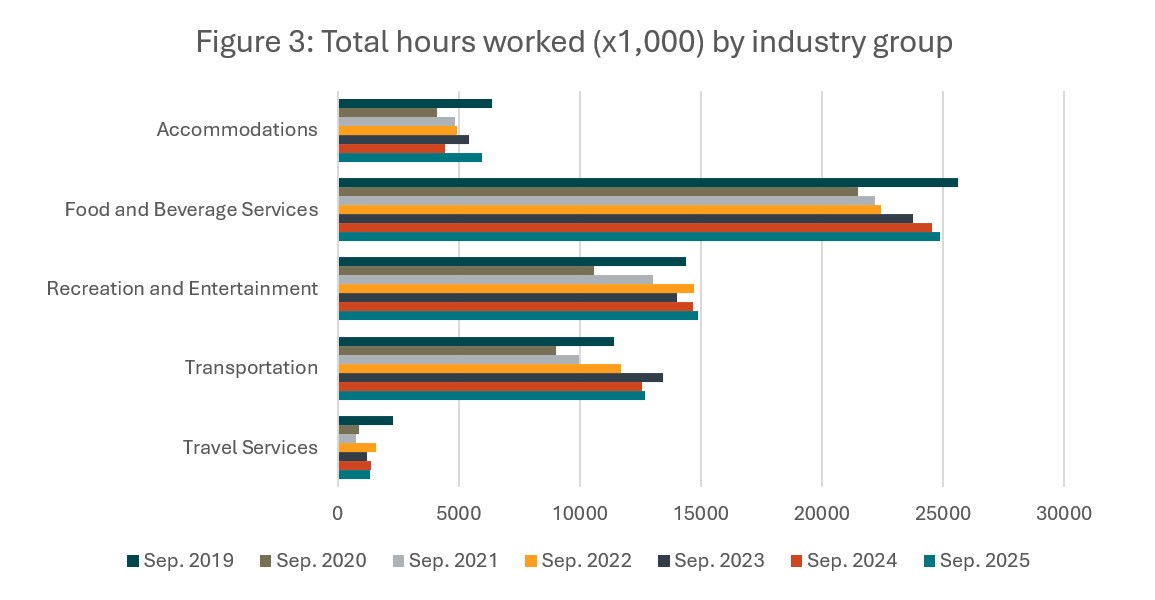
September 2025 saw year-over-year gains in hours worked across all industries except for travel services, which saw a slight decrease (-1.5%) (see Figure 3). Accommodations saw the largest relative increase, which was in large part due to September 2024 seeing a low total of hours worked.
Generally speaking, this year’s growth in hours worked was in line with the trends observed over the past few years, with most industry groups having had at least one abnormally high or abnormally low year within the time frame, except for food and beverage services, which has seen steady year-over-year increases since the low in 2020.
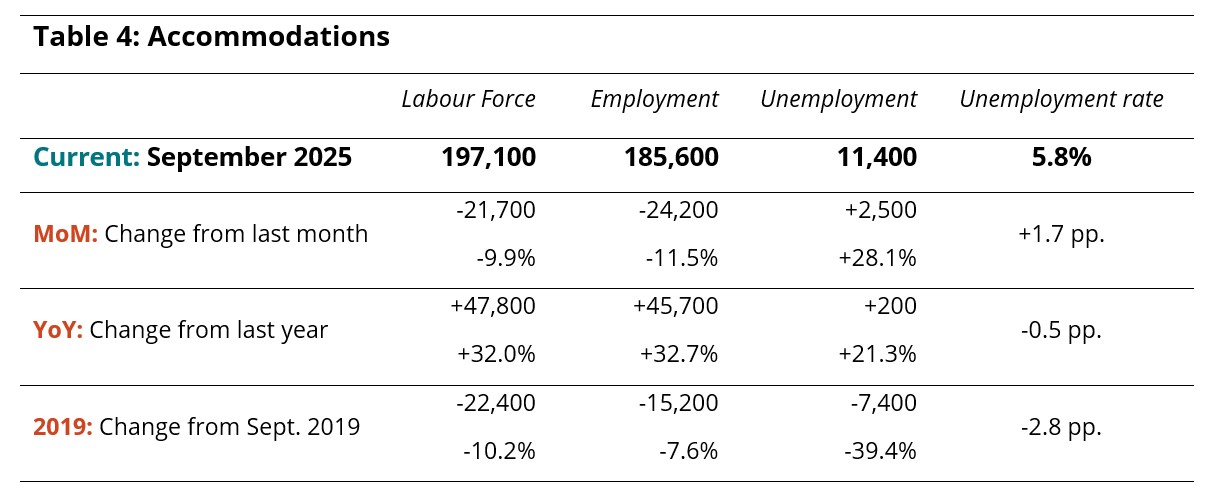
Industry Closeup: Accommodations
Although accommodations saw gains throughout most of the summer (see Table 4), around 24,000 people left employment in this industry in September (-11%), drawing the unemployment rate up to 5.8% from a marked low in August. The picture was more encouraging with respect to last year, where both labour force and employment grew by over 45,000 people, although the industry remained below pre-pandemic levels on both indices.
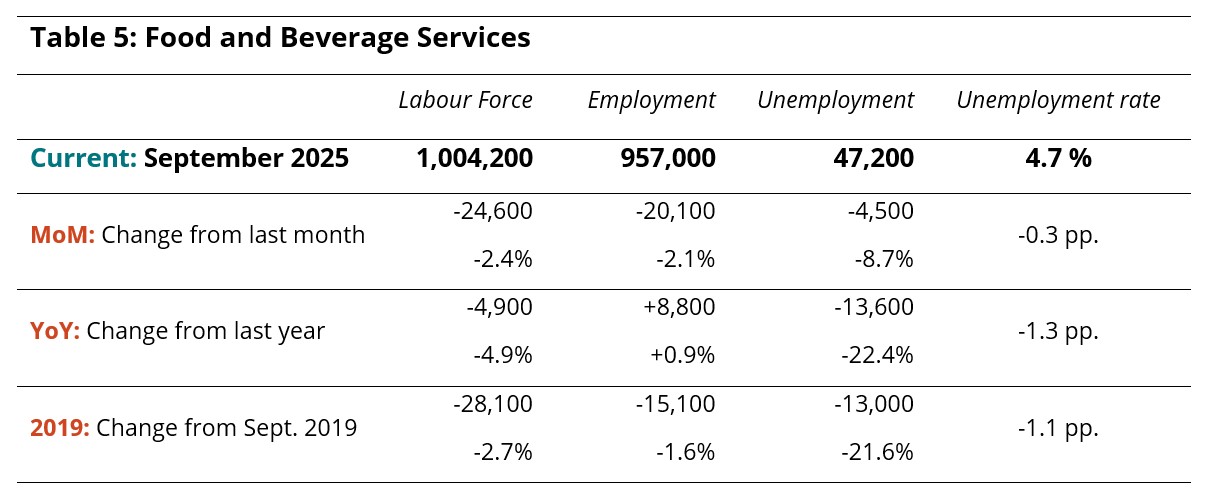
Industry Closeup: Food and Beverage Services
Food and beverage services continued the trend of small losses that started in August (see Table 5), although more people left the labour force than left employment, which drew the unemployment rate down to 4.7%. In September, there were around 1 million people in the labour force, and around 957,000 people in employment across the country. Employment was slightly elevated over last year, while labour force was smaller, and the industry remained two to three percentage points below where it was in 2019.
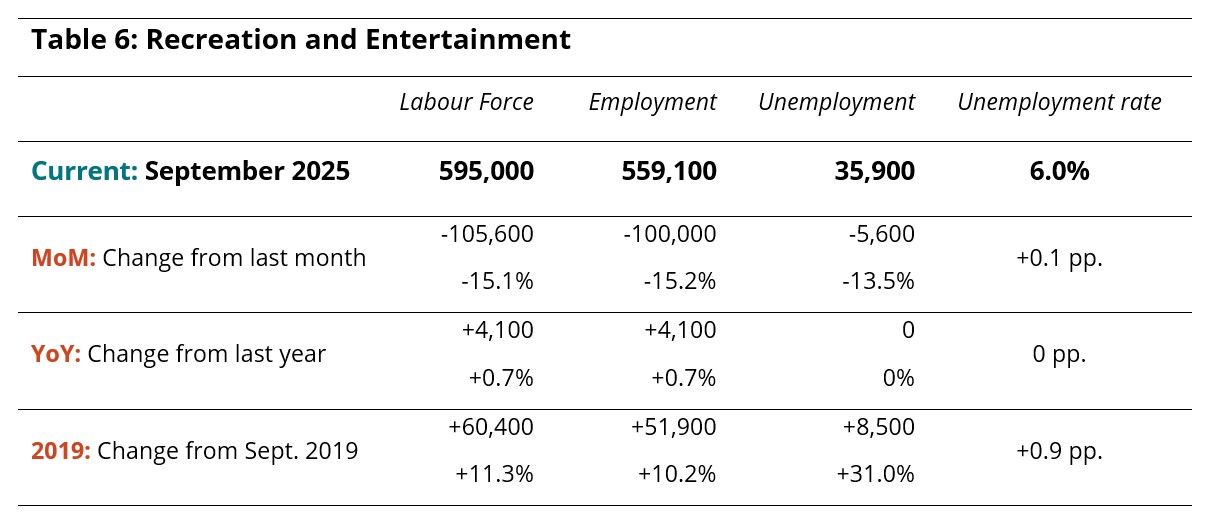
Industry Closeup: Recreation and Entertainment
Recreation and entertainment saw substantial losses to both labour force and employment in September (see Table 6), with both indices decreasing by around 15%, which may reflect a seasonal shift in recreational pursuits as the weather changes. The unemployment rate rose very slightly to 6%. The numbers were slightly better this year than last year, and were around 10% above their levels in 2019.
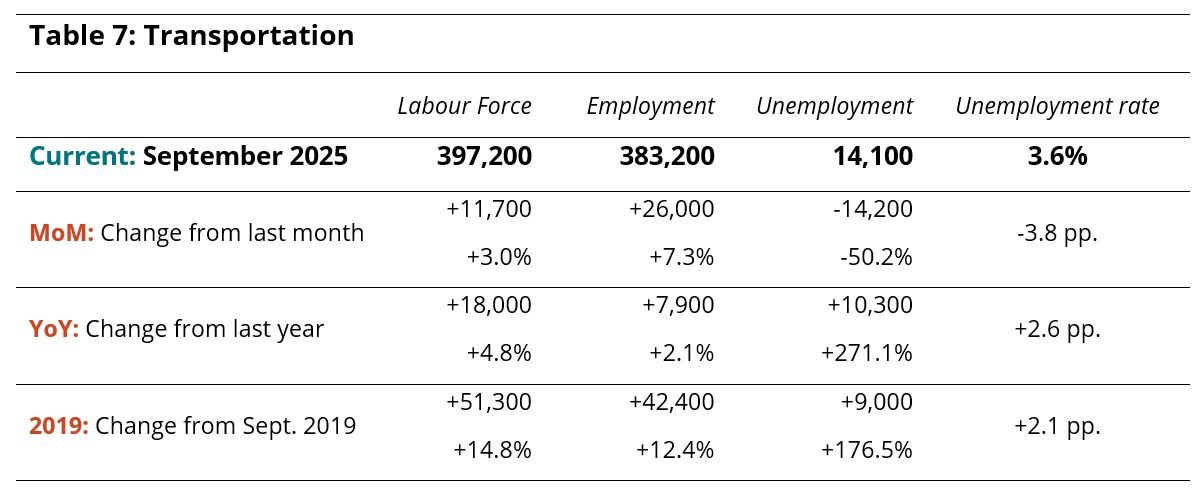
Industry Closeup: Transportation
Transportation saw moderate growth in September (see Table 7), adding 26,000 people to its pool of workers and bringing its unemployment rate down to 3.6% from the abnormally high rate observed in August. This may have to do with the return to school bus service and other related demand increases in urban transportation as the culture transitions from summer to autumn. The industry was also in a stronger position than it was last year, and also relative to 2019.
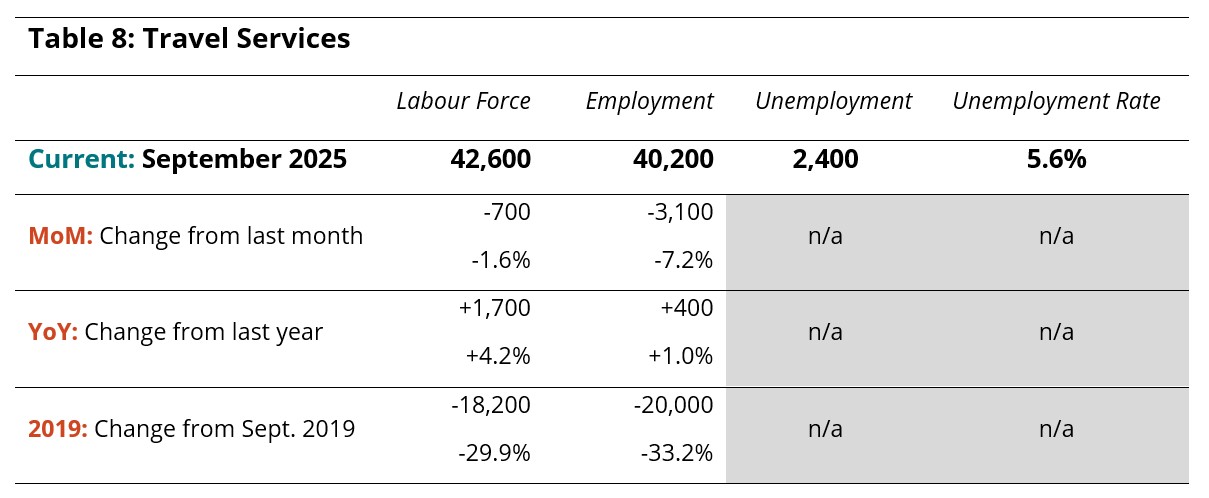
Industry Closeup: Travel Services
Data relating to the travel services industry group is not always reliable, due primarily to its small size relative to the LFS sample, which can lead to substantial suppression in the raw data supplied by Statistics Canada. Because it is a small industry group, it is also prone to disproportionately large swings from month to month, particularly when things are considered as percentages. The data supplied in Table 8 provides some insights into the state of this industry, but should not generally be taken as a static snapshot of labour and employment, but rather as a broad indicator of trends. Overall, the industry remained substantially below 2019 levels in September.
Provincial Perspectives
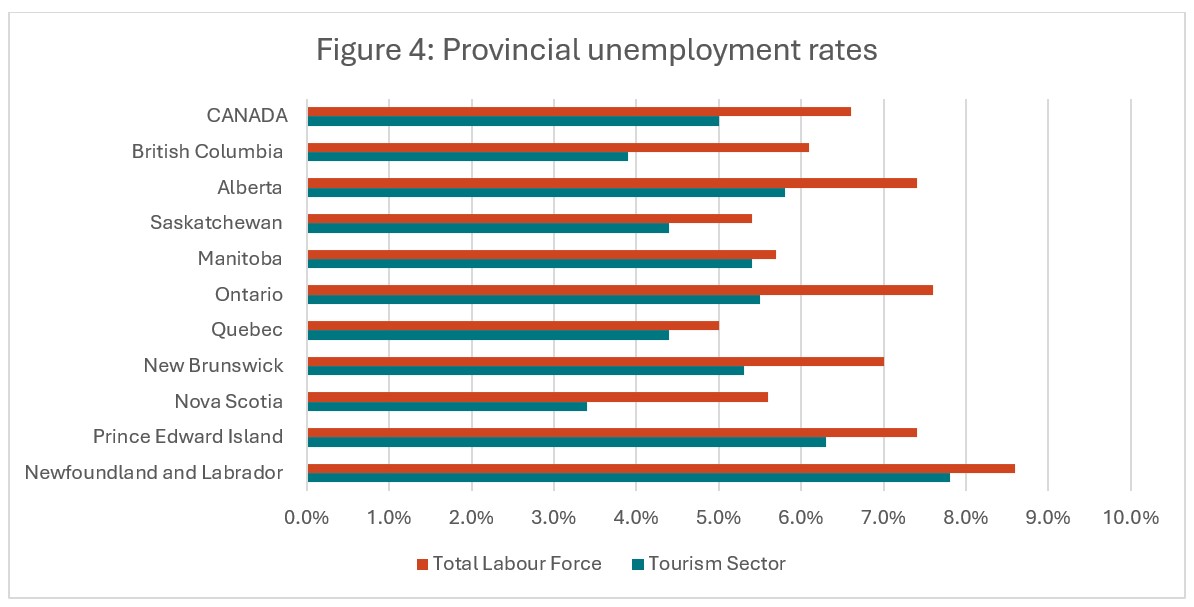
The Canadian economy is subject to some pronounced regional differences, and that is particularly true in the tourism sector. Figure 4 provides a comparison of provincial unemployment rates, for the tourism sector in particular and for the total labour force (i.e., comprising all industries).
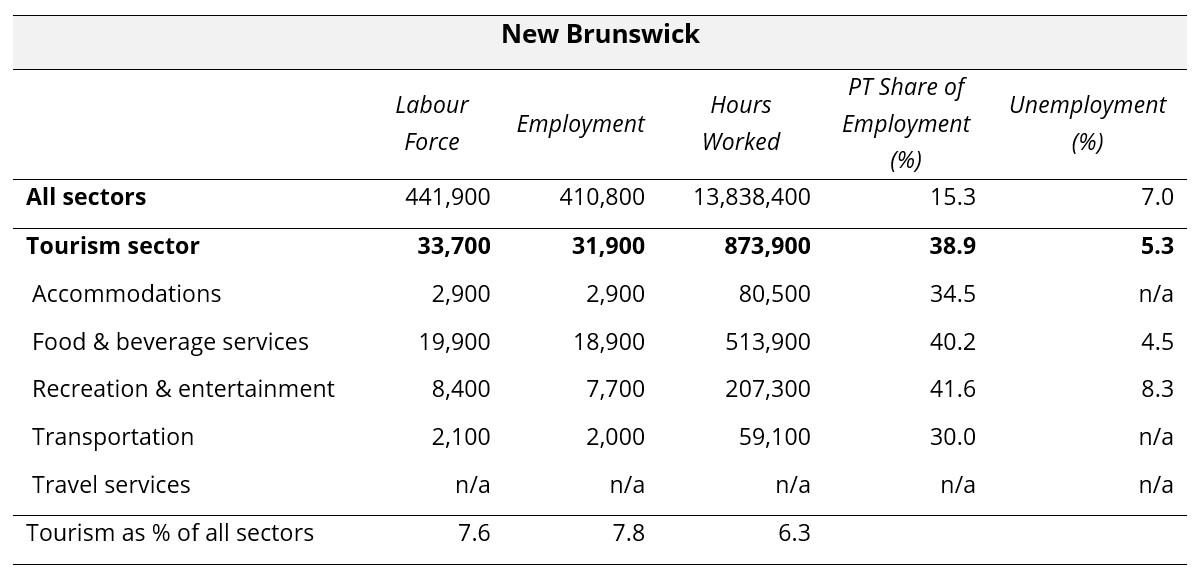
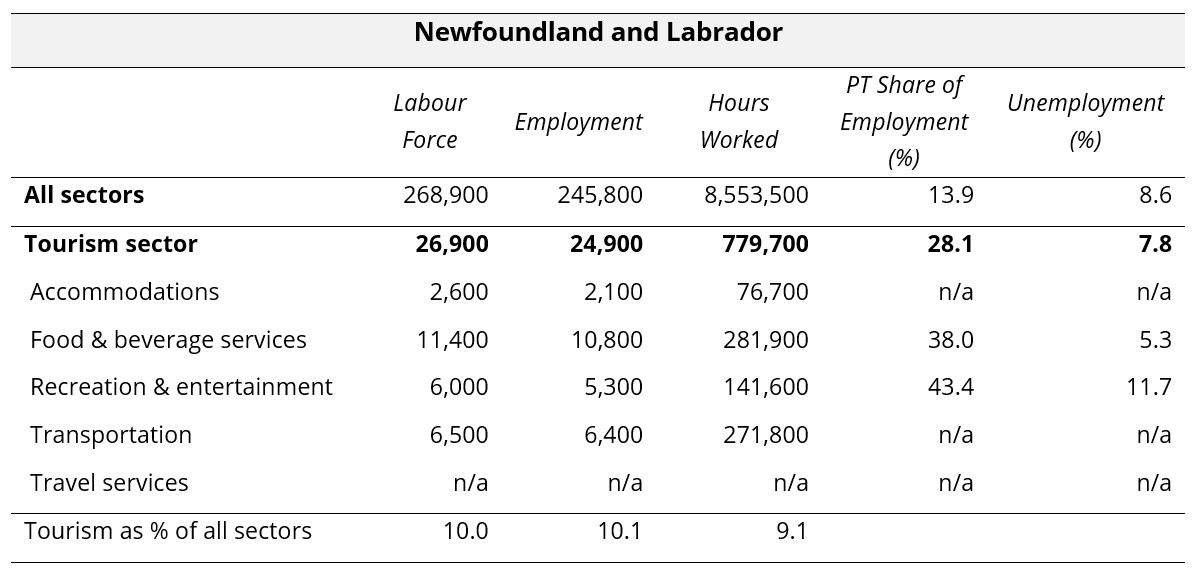
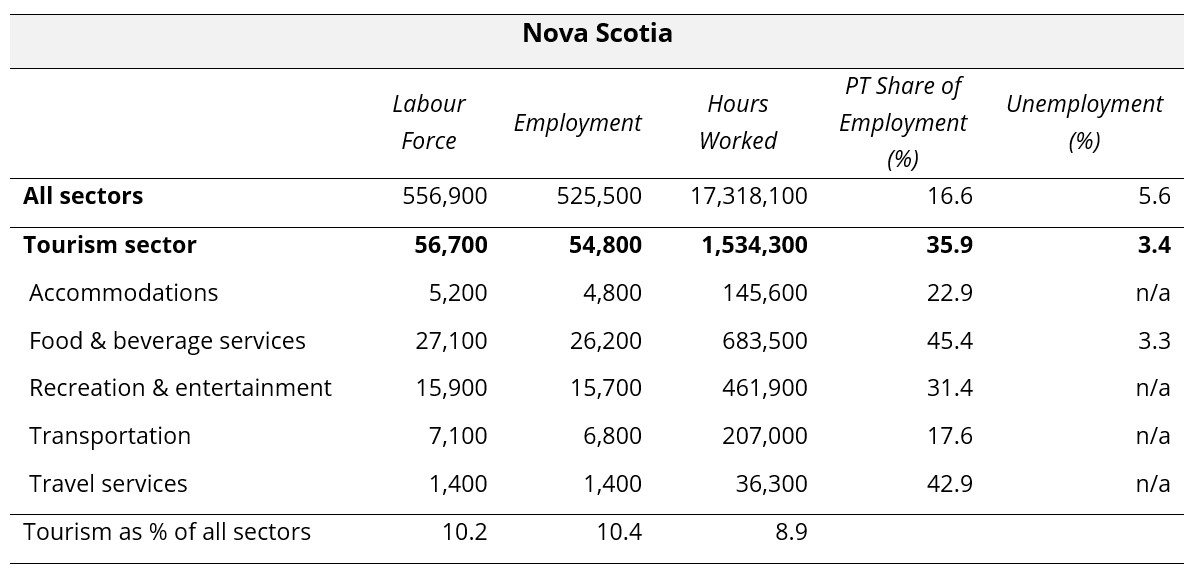
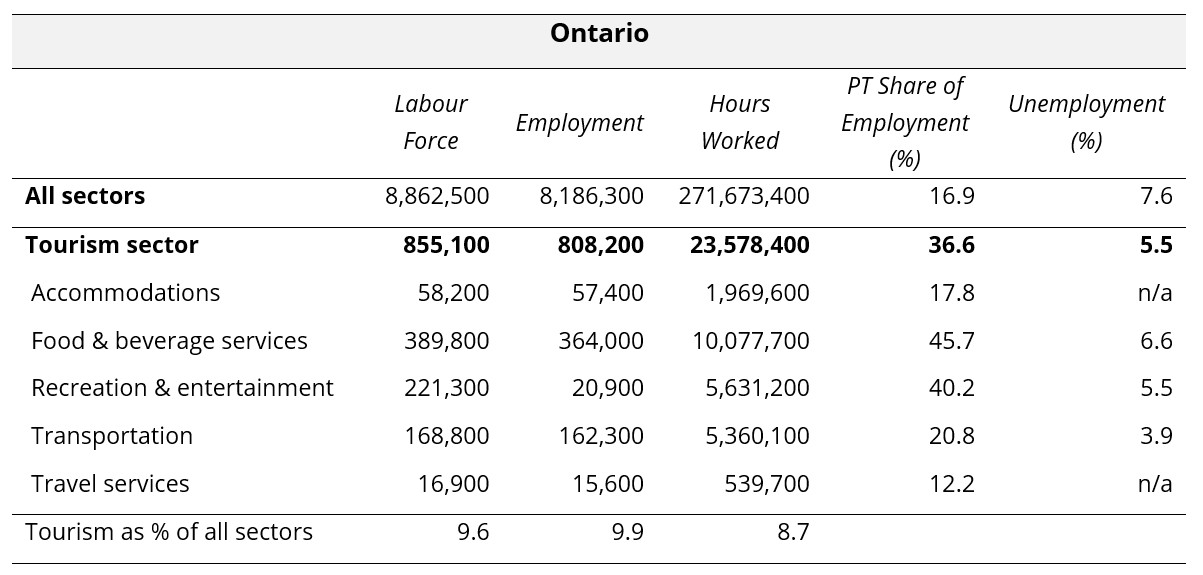
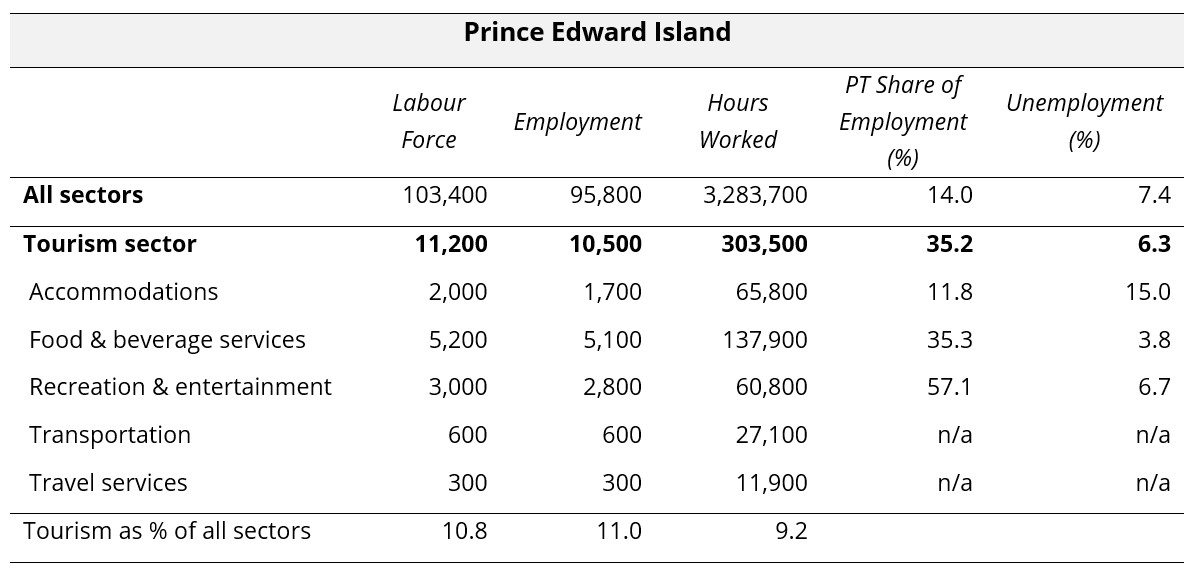
All provinces in September 2025 had lower tourism unemployment rates than those seen across the larger provincial economies, and in four provinces (Alberta, Saskatchewan, Quebec, and Nova Scotia), the provincial tourism unemployment rate was lower than the national average. The highest provincial tourism unemployment rates were in Newfoundland and Labrador (7.8%) and Prince Edward Island (6.3%), while the lowest were observed in Nova Scotia (3.4%) and British Columbia (3.9%). In spite of the seasonal shift and the general tendency for Atlantic Canada to report higher unemployment rates, no province surpassed 10% in tourism.
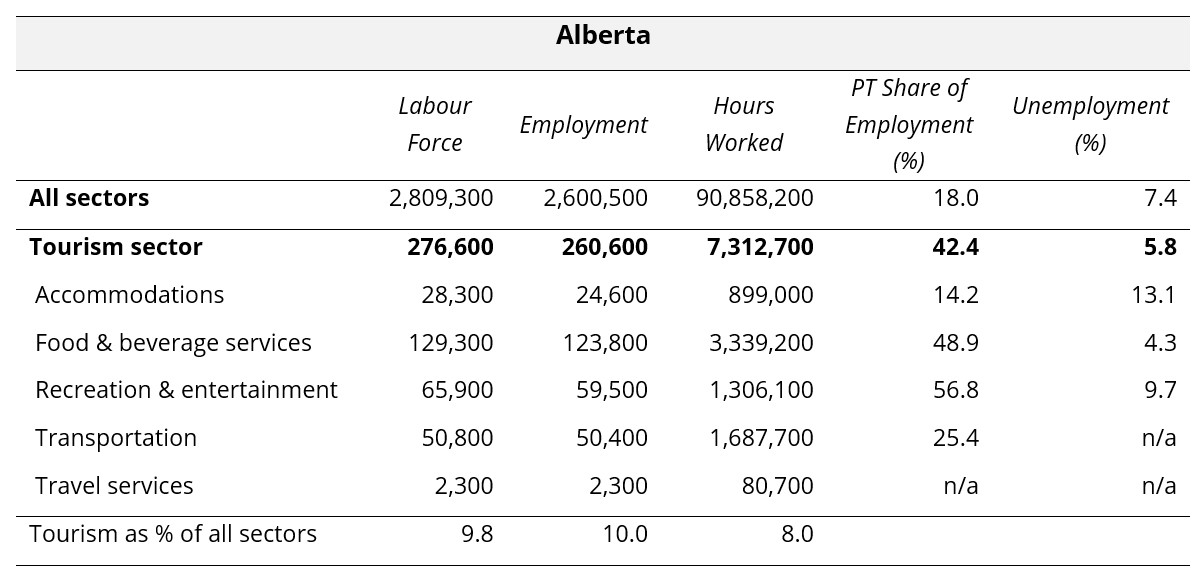
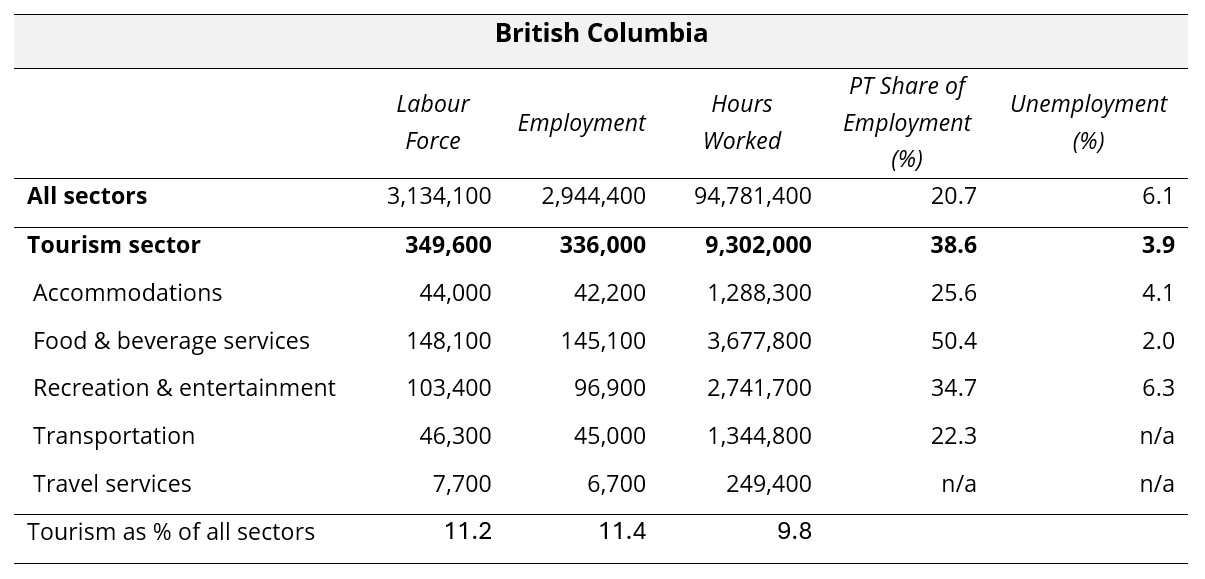
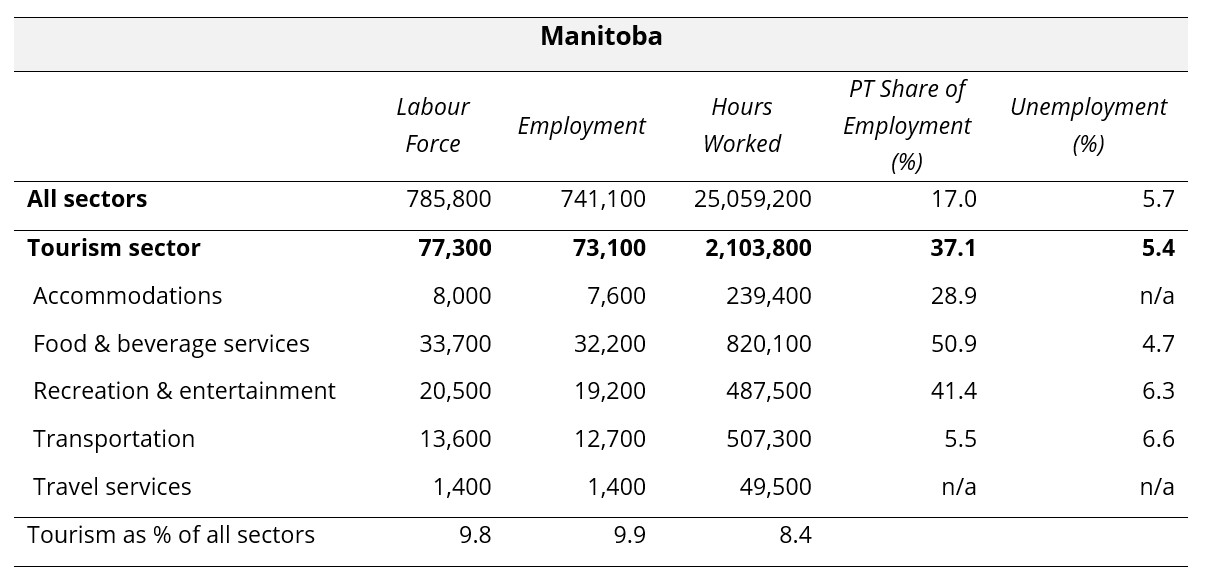
Provincial Summaries for September 2025
The following ten tables provide September 2025 summaries for the provinces, focusing on tourism and its five industry groups. Comparison data is provided for the larger provincial economy as a benchmarking reference. Seasonally unadjusted estimates are provided for labour force, employment, and hours worked, and the final row of each table indicates tourism’s share of each of these metrics. The share of work that is part-time (as opposed to full-time) is also provided, as a rough indicator of the labour composition, as well as the unemployment rates.
Where data was not available due to suppression from Statistics Canada, “n/a” has been entered in the table. The three territories are not included in the LFS releases at this level of granularity, so no comparison is possible between the territories and the provinces. The provinces are listed alphabetically.


View more employment charts and analysis on our Tourism Employment Tracker.
[1] As defined by the Canadian Tourism Satellite Account. The NAICS industries included in the tourism sector those that would cease to exist or would operate at a significantly reduced level of activity as a direct result of an absence of tourism.
[2] SOURCE: Statistics Canada Labour Force Survey, customized tabulations. Based on seasonally unadjusted data collected for the period of September 14 to 20, 2025.