
Autumn Contraction Slows in October
The tourism sector[1] in October 2026 saw some contraction from September[2], which is not unusual for this time of year, and which continues the downward trend that began in August. Losses in labour force outpaced those in employment, which kept the sector unemployment rate below the economy-wide average. Tourism employment settled at 2.1 million, with around 9.4% of the Canadian labour force holding jobs in tourism. The sector’s workforce was around 30,000 below where it was one year previously, but around 25,000 higher than in 2019.
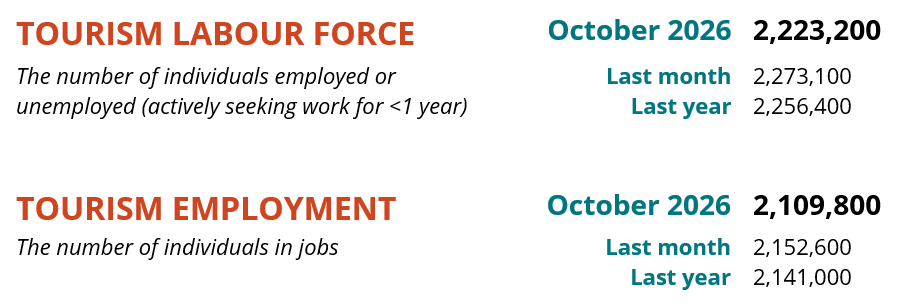
Table 1 provides a snapshot of each industry group’s performance across labour force, employment, and unemployment, as compared with September 2026 [MoM] and October 2025 [YoY], and with October 2019 as a pre-pandemic baseline. Small arrows represent changes of less than 1% (or one percentage point, in the case of unemployment).
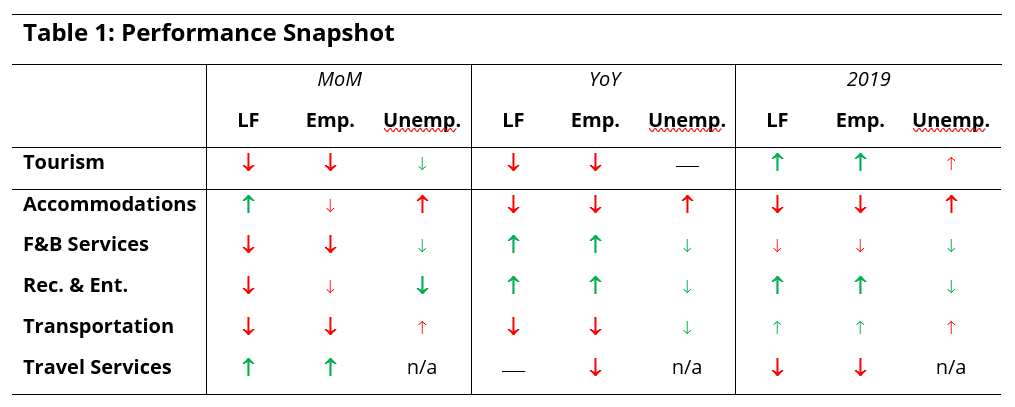
At the industry group level, most industries saw month-over-month losses across both labour force and employment, with only accommodations bucking this trend, seeing gains in labour force alongside losses in employment. Travel services also showed gains, although data relating to this industry group is not always reliable.
Relative to last year, food and beverage services and recreation and entertainment posted workforce growth, although the sector as a whole did not. With respect to 2019 as a baseline, the sector overall showed gains, but these were not distributed evenly across the sector groups, pulled up primarily by growth in recreation and entertainment.
Tourism Sector
The seasonal contraction in tourism employment slowed down from September, with losses in both labour force and employment of around 2% (compared with 7% in September) (Table 2). However, unemployment also fell by around 7,000, which kept the unemployment rate fairly low. Relative to last year, the sector was also depressed from a workforce perspective, but was around 1% larger than it was in 2019.

As a point of comparison, the wider national economy grew slightly (+0.1%) from September, with around 18,000 people entering employment (Table 3). The unemployment rate across the full economy held steady at 6.2% from September (calculated using seasonally unadjusted data), which remained higher than the unemployment rate in tourism.
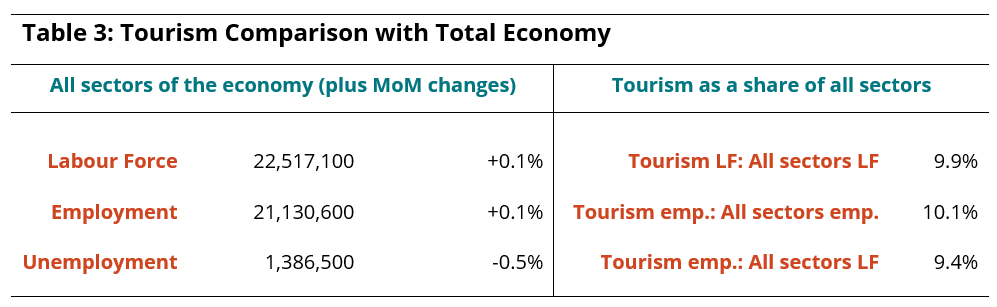
In October, tourism accounted for 10.1% of all employment in Canada, with around 9.4% of the broader Canadian labour force working in tourism. Both figures were largely unchanged with what they were in September.
Part-Time and Full-Time Employment
Changes in the ratio of part-time to full-time work provides an interesting perspective on the stability of the workforce. Historically, the sector as a whole has had an aggregate of around 40% part-time workers, although there were substantial shifts during the COVID-19 pandemic. At the industry level, food and beverage services and recreation and entertainment tend to have much higher rates of part-time employment, while accommodations, transportation, and travel services tend towards a larger share of full-time workers (Figure 1). In accommodations, the share of part-time work has fallen somewhat from 2019, as it has in food and beverage services, while the share of part-time work increased by around 5 percentage points over the same time period.

From September, full-time employment fell by around 42,000 people (at the sector aggregate level), while part-time employment fell by only around 600, meaning that the shift towards part-time work was prompted more by the loss of full-time workers than by the increase in part-time work. Accommodations saw a loss of around 3,300 people in full-time employment but an increase of 2,300 in part-time. In recreation and entertainment, 15,000 people left full-time employment and 10,700 entered part-time employment. Some of these changes may reflect reductions in hours worked, or complete turnover in staff rosters. Full-time employment in food and beverage services fell by 23,600, while part-time employment grew by around 900, which reflects an actual diminishment of the overall workforce for this industry group. In contrast, transportation saw larger losses in part-time employment (-13,300) than in full-time employment, which pulled its share down.
Hours Worked
The total number of hours worked provides another interesting insight on the stability of the workforce, as businesses are more readily able to scale up hours and shifts than they are to hire or fire workers. This means that this index can be more responsive to changes in customer demand.
October saw a decrease in total hours worked of around 7% (Figure 2), which outpaced the loss in employment and aligns with the shift towards slightly more part-time work. Total hours worked were around 1% higher than they were in 2019, marking a slowdown that is out of pace with the gains seen over the summer. This suggests that the workforce increases over the summer were a seasonal anomaly—likely buoyed by Canada-US tensions that spurred greater domestic travel—rather than an indicator of long-term trends for the sector.

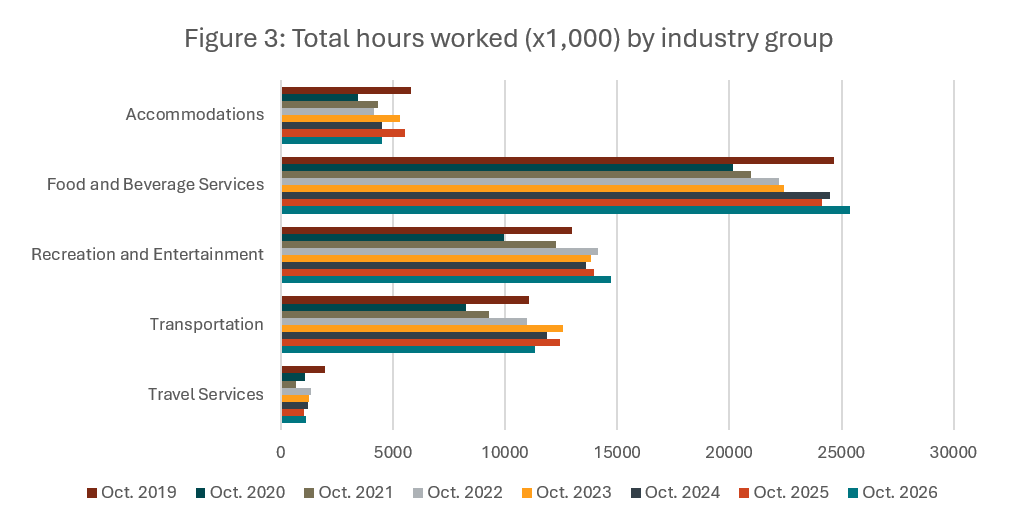
At the industry level (Figure 3), and viewed on a year-over-year basis, accommodations and transportation saw their total hours worked fall substantially from last year, with accommodations further remaining well below 2019 levels (-22%). The recovery trajectory for this industry group has been much less consistent than that seen in the two largest industry groups: both food and beverage services and recreation and entertainment have reported fairly steady year-over-year growth, and have surpassed 2019 levels (+3% and +13%, respectively). The monotonic increase in transportation stalled in 2023, and has fluctuated since then, while the hours worked in travel services have remained well below 2019 levels, as have raw employment levels (see Table 9, below).
Youth in Tourism
Young Canadians are facing mounting barriers in getting attached to the labour market, particularly in the face of AI changes to the characteristics of entry-level jobs across many industries. In this context, tourism’s role in providing accessible entry points to the workforce becomes even more important. The core transferrable employment skills that young people develop through tourism employment will follow them throughout their careers, whether they remain in tourism or take their experiences with them into other sectors.
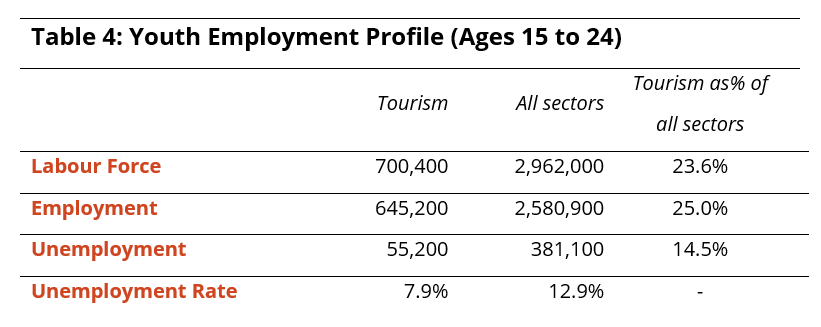
In October, the youth unemployment rate in tourism rose slightly from September (+0.6 percentage points) while that of the total economy held steady near 13%, but the rate in tourism remained comfortably below that across all sectors (Table 4). Around 11,000 youth left employment in the sector from September, which accounted for around one-quarter of all employment loss over the past month, and so is on par with youth’s overall share of tourism employment. And while one-quarter of all working youth in Canada held jobs in tourism, tourism accounted for only 14.5% of all unemployed youth.
Industry Closeup: Accommodations
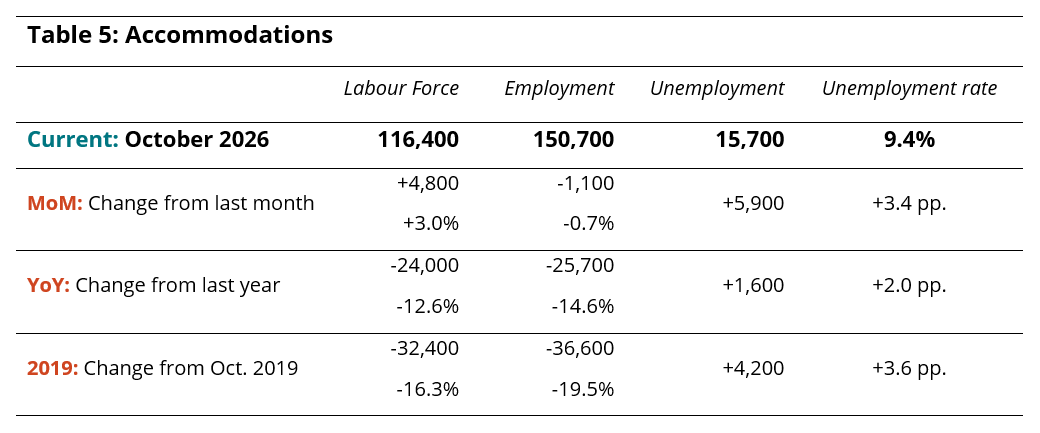
The accommodations industry saw nearly 5,000 people join its labour force in October (Table 5), although it also lost around 1,000 people from employment, which together pulled the unemployment rate up to 9.4%. Employment at the national level stood at around 150,000 people. Both labour force and employment fell relative to last year, and remained over 15% below 2019 levels. In spite of some promising signs earlier this year, this industry group is once again struggling to return to a post-pandemic growth trajectory.
Industry Closeup: Food and Beverage Services
Continuing the trend from September, employment in food and beverage services lost over 20,000 workers in October, bringing the employment total to just shy of 983,000 people, out of a labour force of just over 1 million. Losses in labour force narrowly outpaced those in employment, which kept the unemployment rate near 5%. The industry was in a stronger position than this time last year (around +2%), although it was largely unchanged from the numbers seen in October 2019.

Industry Closeup: Recreation and Entertainment
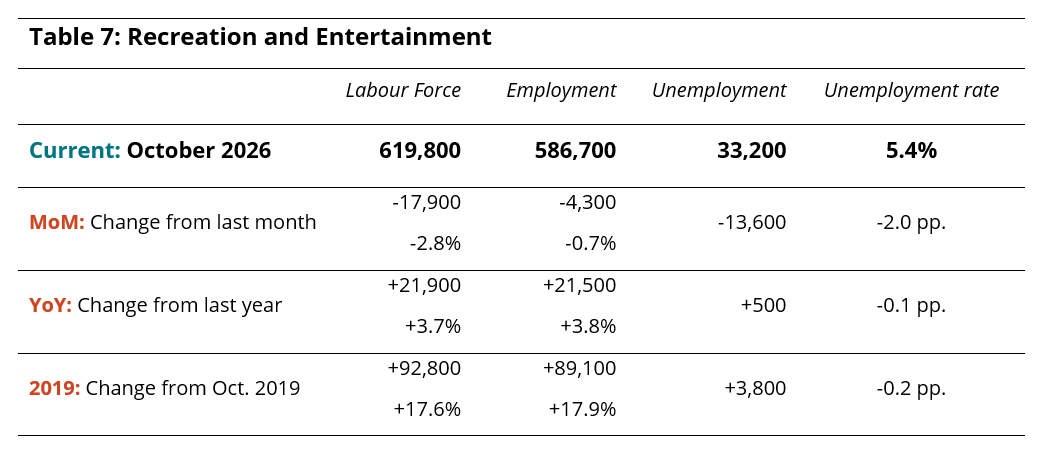
The substantial losses noted in September for recreation and entertainment slowed considerably in October, although the industry did not reverse the seasonal downturn (Table 7). Employment slipped to 587,000 (-0.7%), while labour force fell by 2.8%, which together lowered the unemployment rate. Relative to last year and to 2019, the unemployment rate for October was comparable this year, and both labour force and employment were higher, substantially so with respect to the size of the industry before the pandemic.
Industry Closeup: Transportation
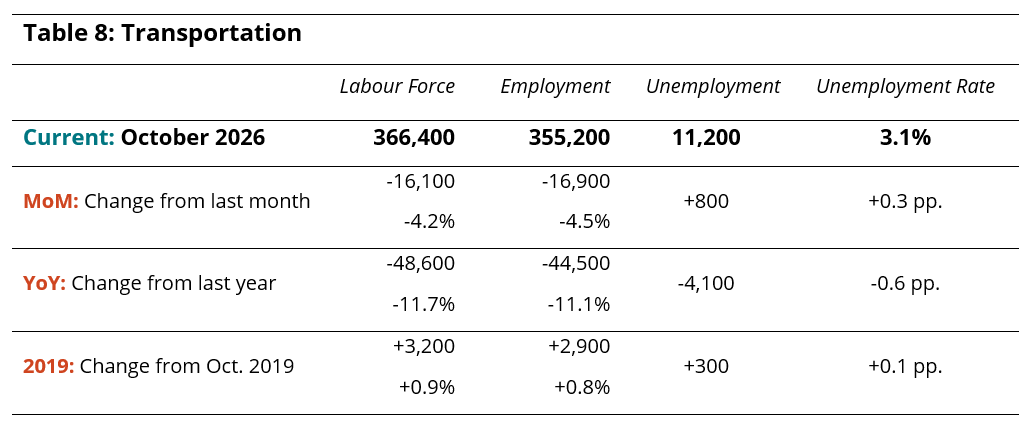
Transportation saw moderate losses from September and more substantial losses relative to last year (Table 8), with employment dropping to 355,000 from nearly 400,000 one year ago. Both employment and labour force were little changed from 2019, and although the unemployment rate crept up to 3.1%, it remained the lowest out of the five industry groups.
Industry Closeup: Travel Services
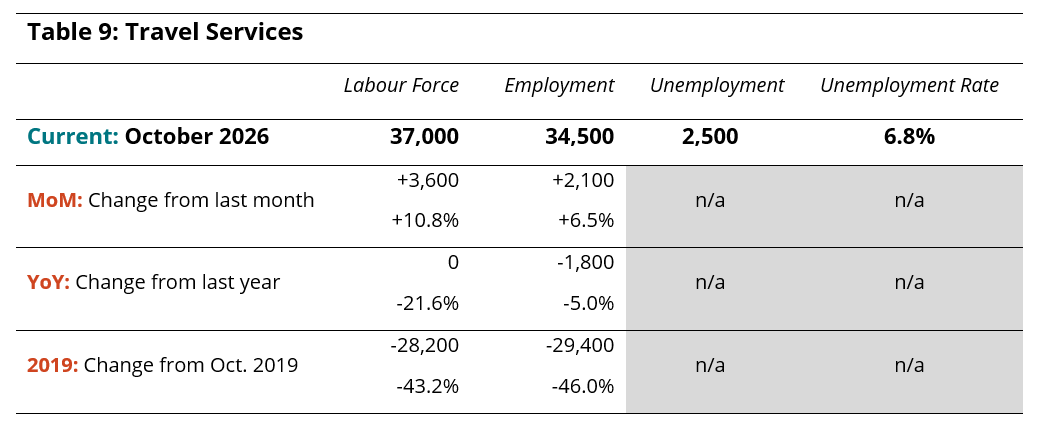
It is important to note that data relating to travel services tends to show disproportionate and uneven changes across the LFS time series, largely in part to the sampling methodology of the survey in relation to the size of this industry group within the overall Canadian economy. The data in Table 9 reflects the latest estimates from Statistics Canada, but should be treated with caution, without too much weight being put on observed monthly fluctuations. In the long run, the industry group has remained substantially below its pre-pandemic levels for several years now, and seems unlikely to gain much lost ground in the near future. In part, this failure to rebound likely reflects the impacts of AI and other technological developments on travel booking and tour arrangement services.
Provincial Perspectives
The Canadian economy is subject to some pronounced regional differences, and that is particularly true in the tourism sector. Figure 4 provides a comparison of provincial unemployment rates, for the tourism sector in particular and for the total labour force (i.e., comprising all industries).
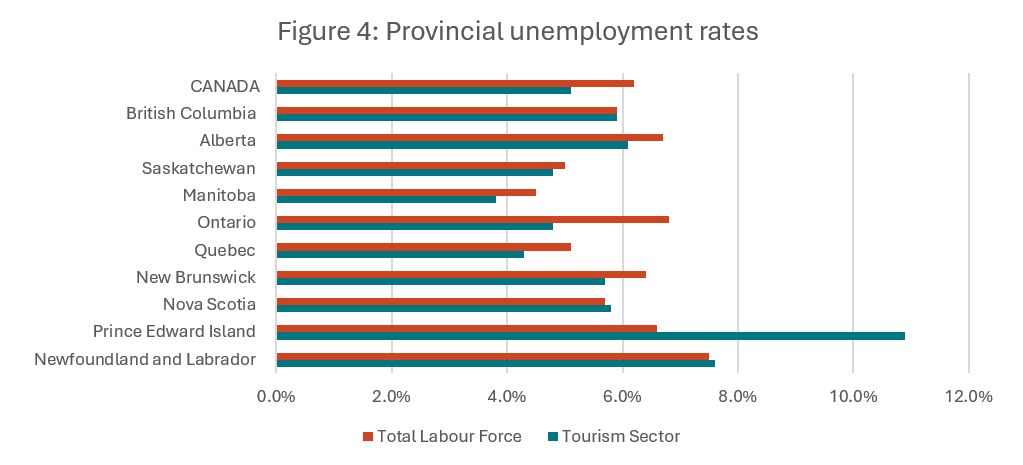
In October, the national unemployment rate in tourism was 5.1%, lower than the economy-wide average of 6.2% (calculated using seasonally unadjusted data). As is often the case at this time of year, provincial tourism unemployment rates outpaced their economy-wide counterparts in three of the four Atlantic provinces, which are susceptible to a stronger seasonal effect than other parts of the country. The effect was strongest in Prince Edward Island (a difference of 4.3 percentage points), while in Nova Scotia and Newfoundland and Labrador, tourism just nosed past the economy-wide average. Provincial unemployment rates ranged from 3.8% in Manitoba to 10.9% in Prince Edward Island.
Provincial Summaries for October 2026
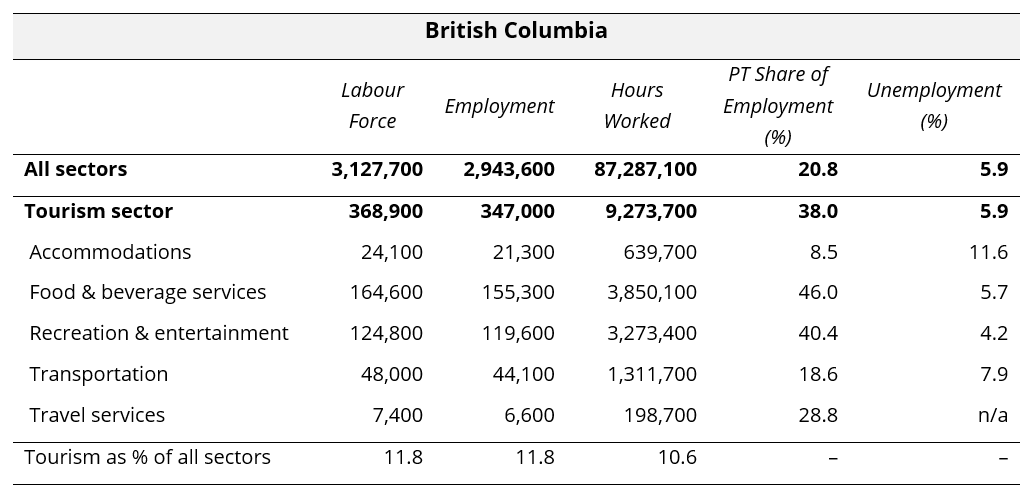
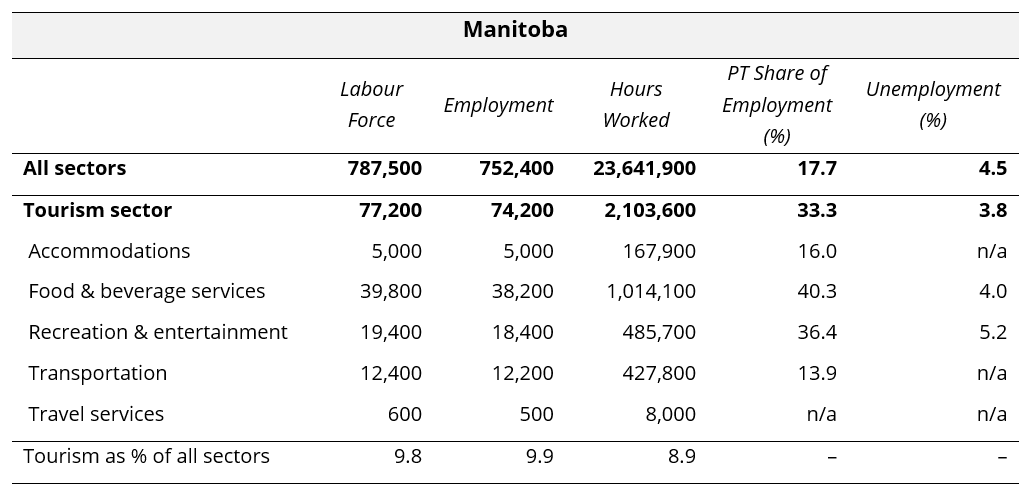
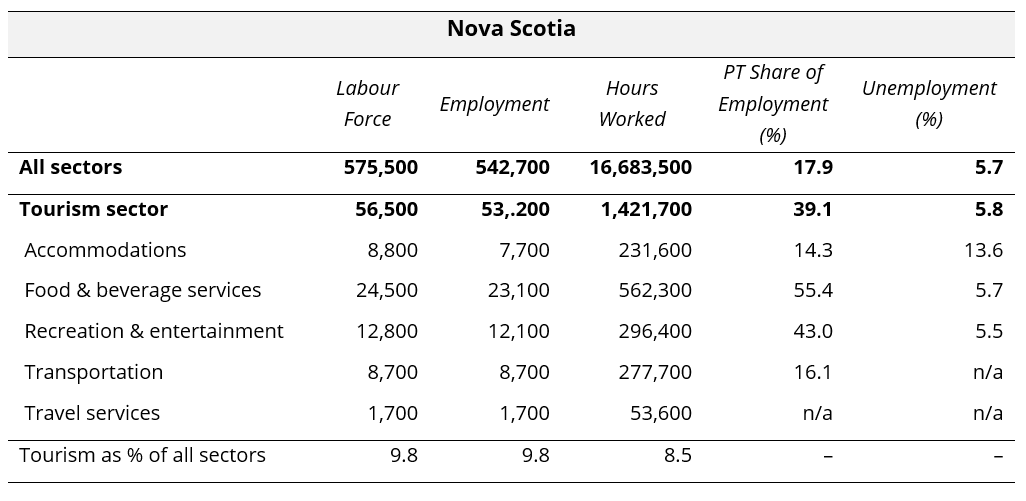
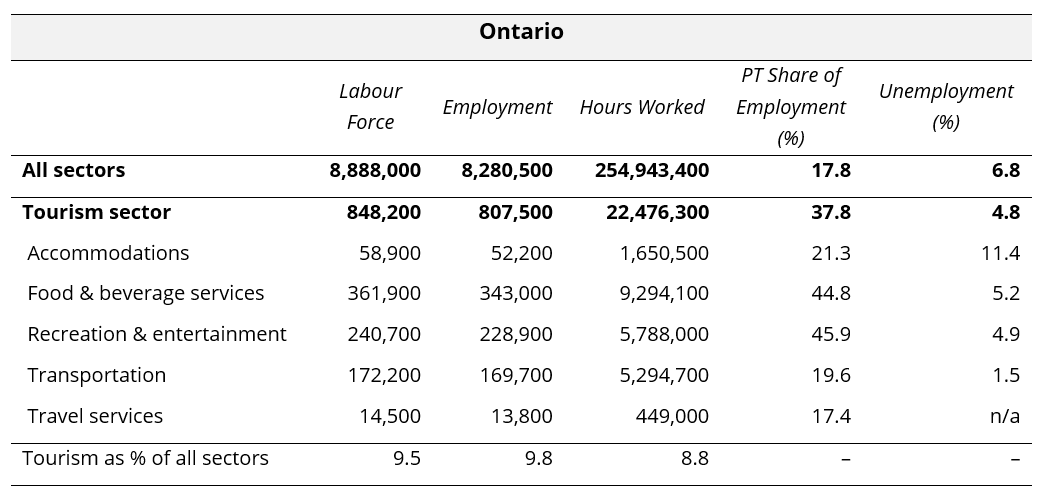
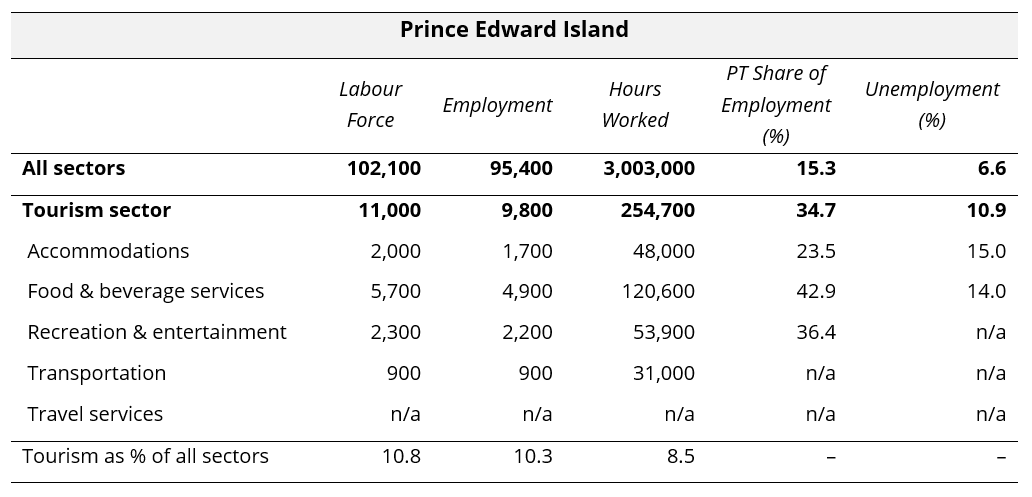
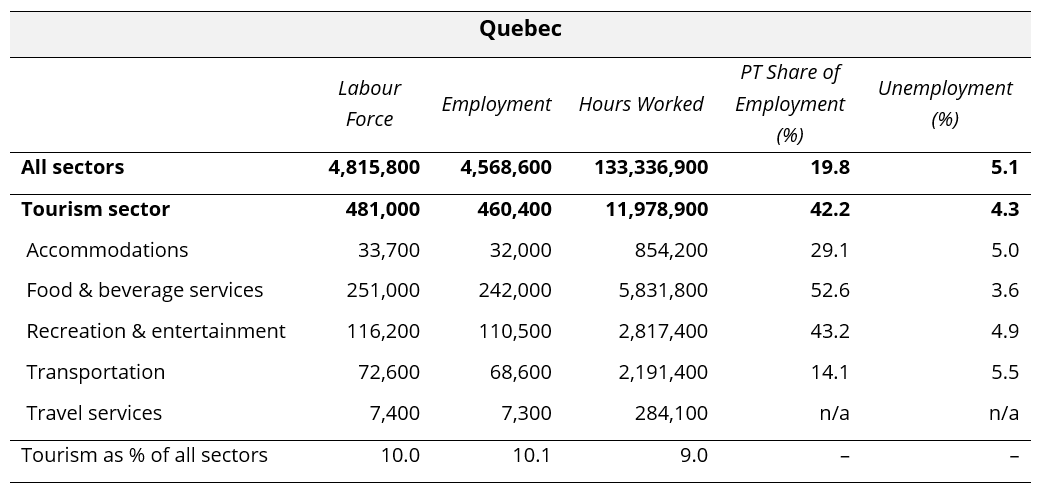
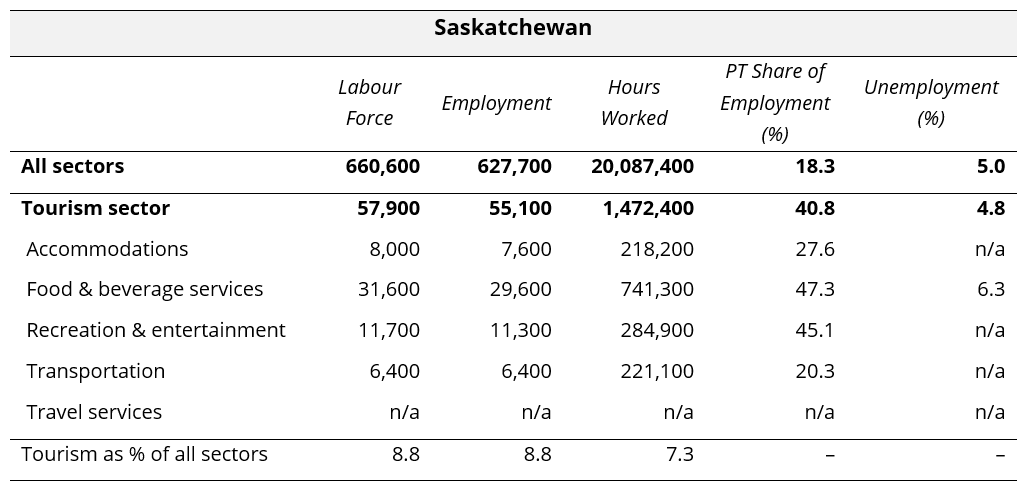
The following ten tables provide October 2026 summaries for the provinces, focusing on tourism and its five industry groups. Comparison data is provided for the larger provincial economy, as a benchmarking reference. Seasonally unadjusted estimates are provided for labour force, employment, and hours worked, and the final row of each table indicates tourism’s share of each of these metrics. The share of work that is part-time (as opposed to full-time) is also provided, as a rough indicator of the labour composition, as well as the unemployment rates.
Where data was not available due to suppression from Statistics Canada, “n/a” has been entered in the table. The three territories are not included in the LFS releases at this level of granularity, so no comparison is possible between the territories and the provinces. The provinces are listed alphabetically.



View more employment charts and analysis on our Tourism Employment Tracker.
[1] As defined by the Canadian Tourism Satellite Account. The NAICS industries included in the tourism sector those that would cease to exist or would operate at a significantly reduced level of activity as a direct result of an absence of tourism.
[2] SOURCE: Statistics Canada Labour Force Survey, customized tabulations. Based on seasonally unadjusted data collected for the period of October 11 to 17, 2026.