Module des ressources humaines en tourisme
Commandé par RH Tourisme Canada et produit par Statistique Canada, le Module des ressources humaines en tourisme (MRHT, anciennement Module provincial-territorial des ressources humaines [ MPTRH ]) fournit des données sur l’emploi dans le secteur du tourisme pour l’ensemble du pays, y compris les territoires. Il complète le nouveau MRHT pour l’ensemble de l’économie produit par Statistique Canada, qui fournit un point de comparaison utile pour le secteur du tourisme.
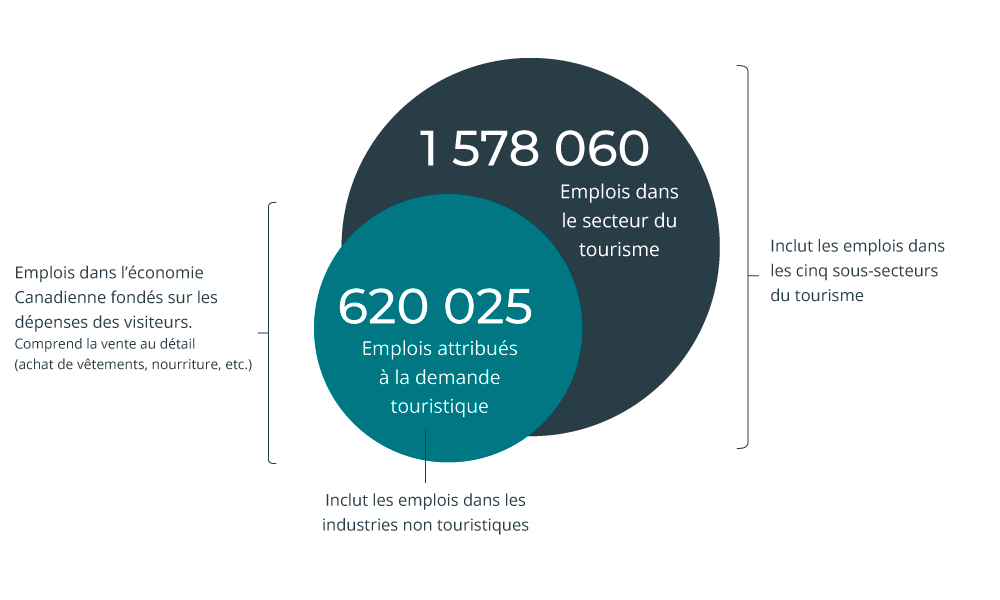
Il est important de noter que le nombre d’emplois indiqué dans le MRHT est différent du nombre d’emplois indiqué dans les Indicateurs nationaux du tourisme (INT) de Statistique Canada.
- Le INT fait état des « emplois attribuables au tourisme ». Il s’agit de tous les emplois au Canada soutenus par les dépenses des Canadiens et des visiteurs étrangers, y compris certains emplois en dehors du secteur du tourisme.
- Le MRHT rend compte des « emplois dans les industries du tourisme ». Il s’agit de tous les emplois au sein des cinq secteurs associés touristiques qui peuvent être subdivisés en 29 industries spécifiques considérées comme faisant partie du secteur du tourisme. Nombre de ces emplois sont soutenus par les dépenses des résidents locaux, en particulier dans des secteurs tels que la restauration, les loisirs et les divertissements, qui tirent d’importants revenus de la population locale et des visiteurs canadiens et étrangers.

Faits marquants du module 2022 sur les ressources humaines en tourisme
Vous trouverez ci-dessous quelques-unes des principales informations tirées du MRHT, édition 2022. Un résumé complémentaire des statistiques clés est disponible auprès de Statistique Canada et l’ensemble des données sera bientôt téléchargé sur notre outil de reCherche rapide. Abonnez-vous à notre bulletin d’information, le Tourism HR Insider, pour être informé en primeur de la disponibilité de ces données.
Remarque : Lorsque l’on examine les données salariales, il est important de souligner qu’elles sont agrégées par secteur d’activité plutôt par profession. Cela signifie qu’il n’est pas possible de déduire directement les écarts salariaux (différences de taux de rémunération pour des emplois identiques ou comparables), mais seulement les écarts de revenus (observations approximatives sur les différents niveaux de revenus, indépendamment des professions). Ceci est particulièrement important lorsque l’on effectue des observations relatives aux catégories démographiques, telles que l’âge et le sexe : les données salariales sont en corrélation avec les professions, et ces professions ne sont pas uniformément réparties au sein de la population. Pour les demandes concernant des données spécifiques, veuillez envoyer un courriel à l’adresse suivante : research@tourismhr.ca.
